Built for engineers who want full visibility into their Redis clusters without compromising on security.
🔑
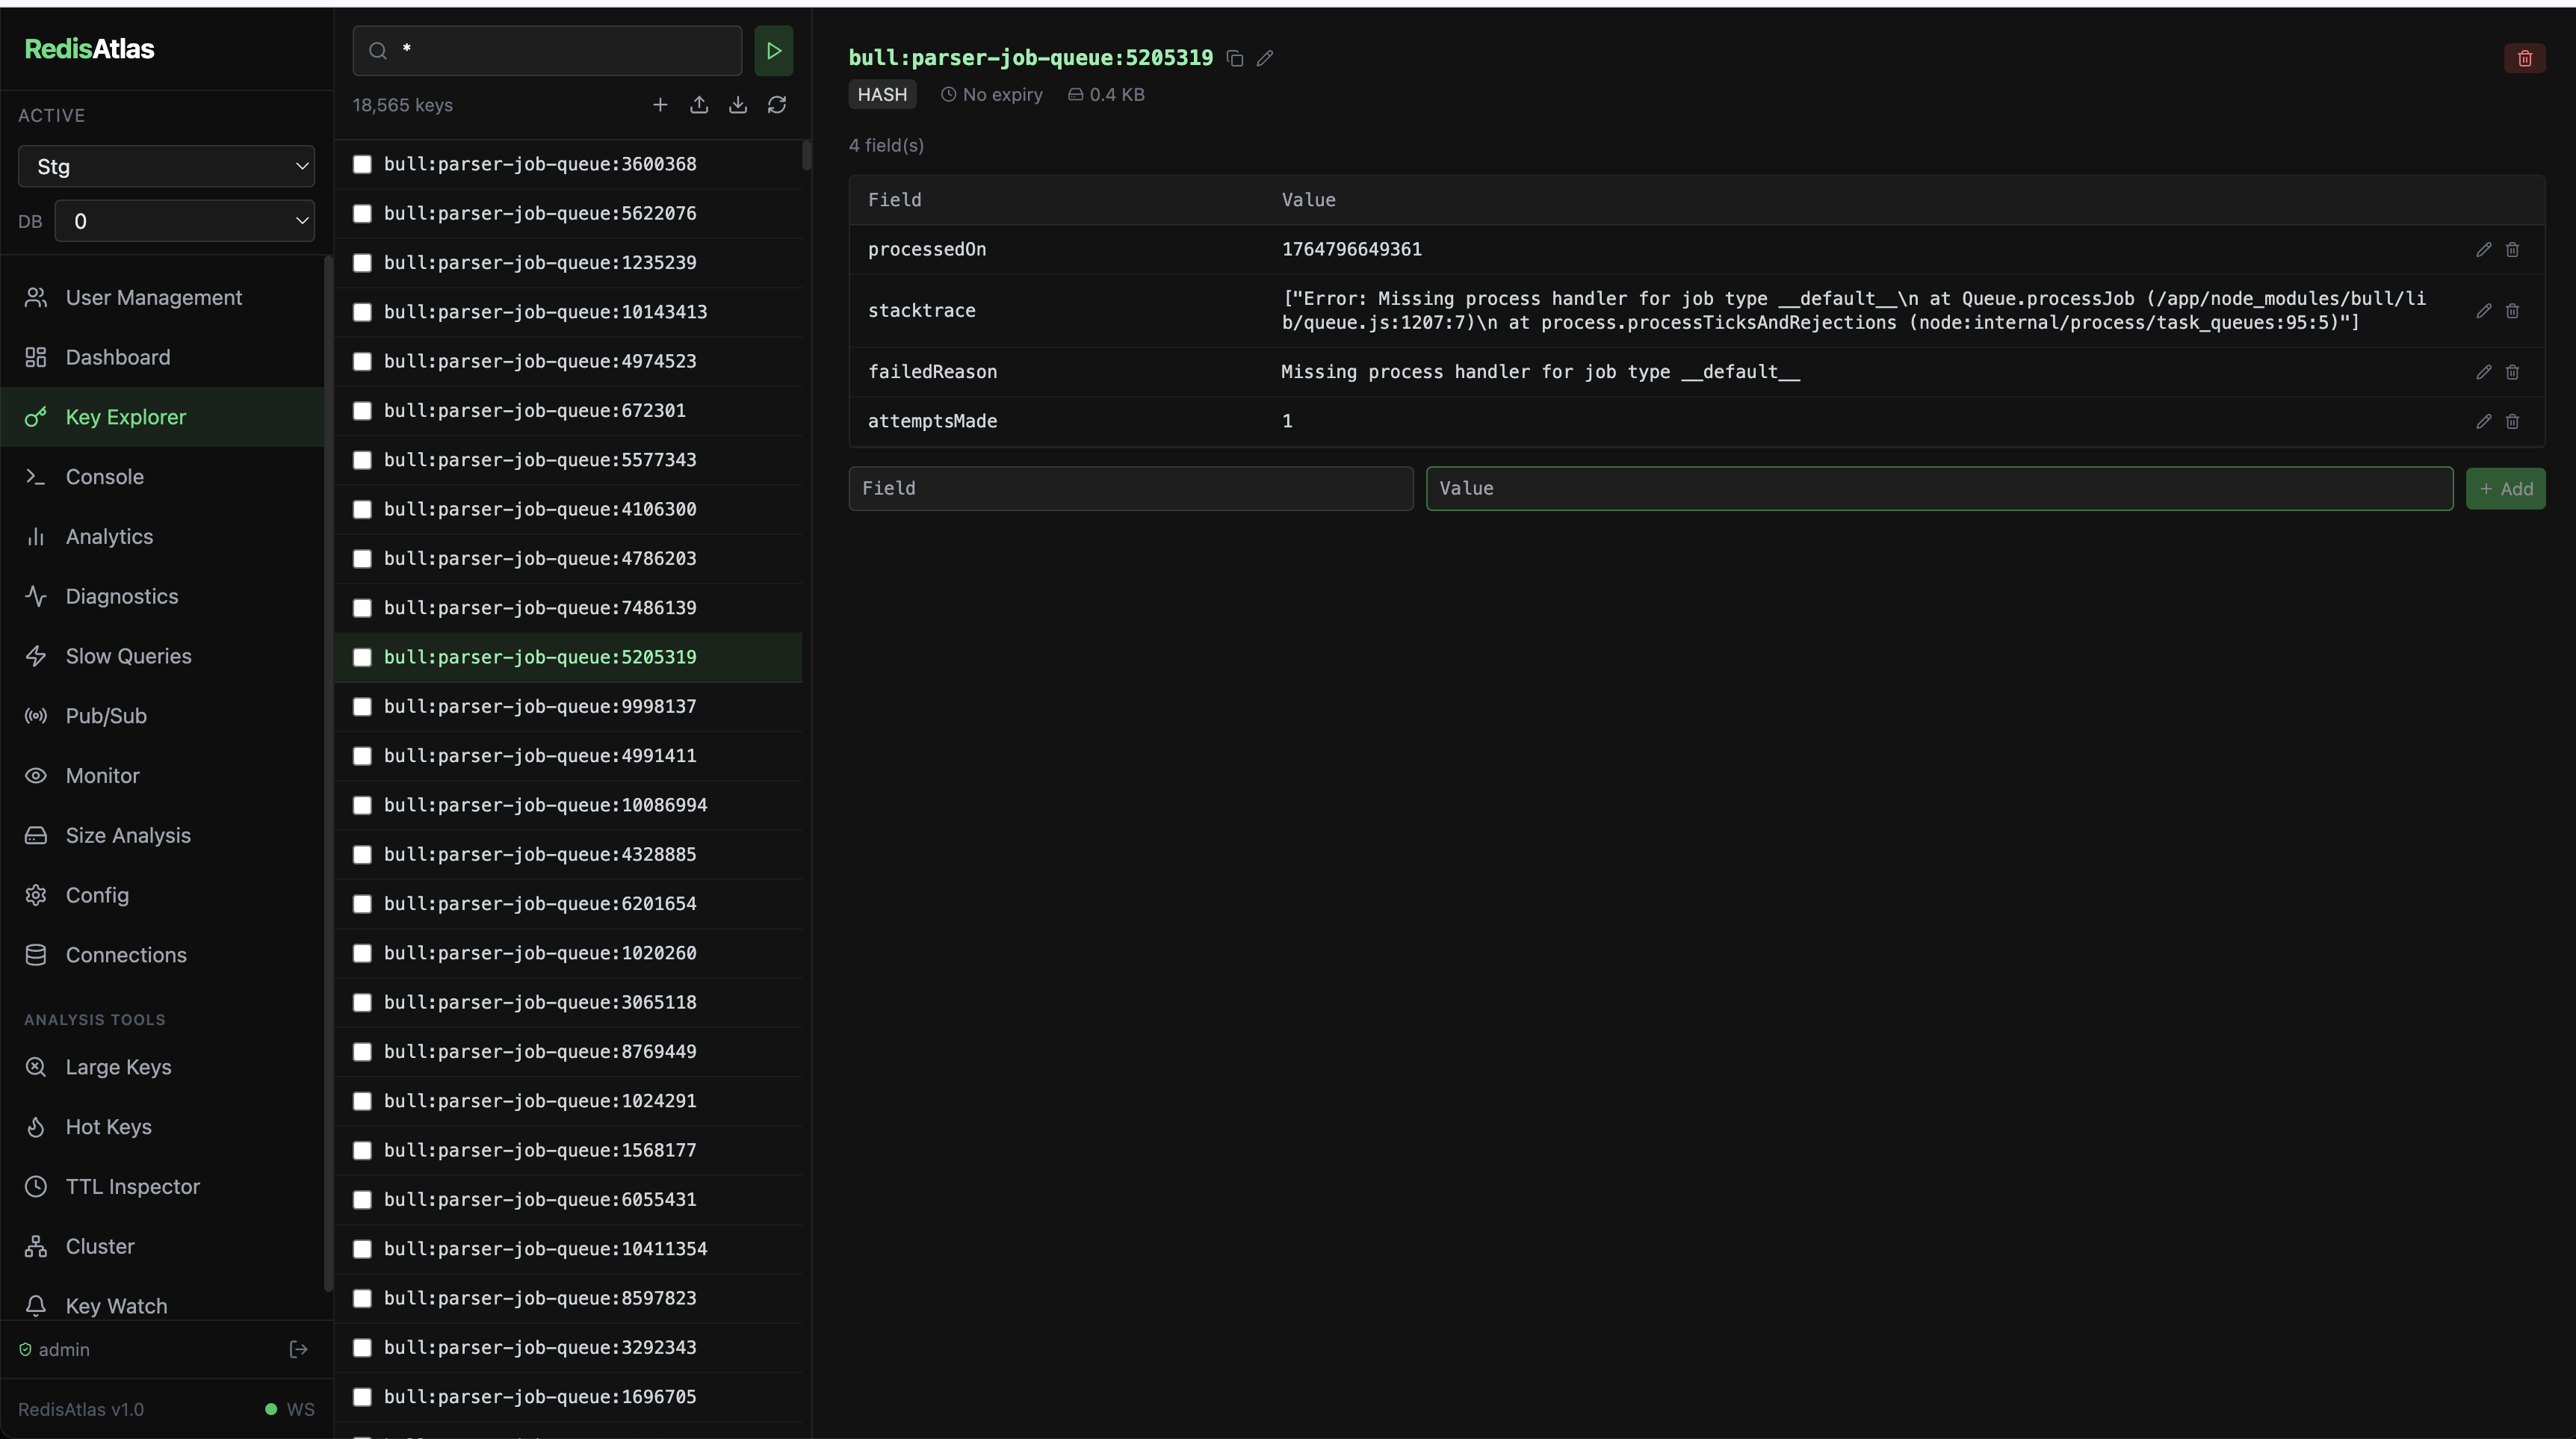
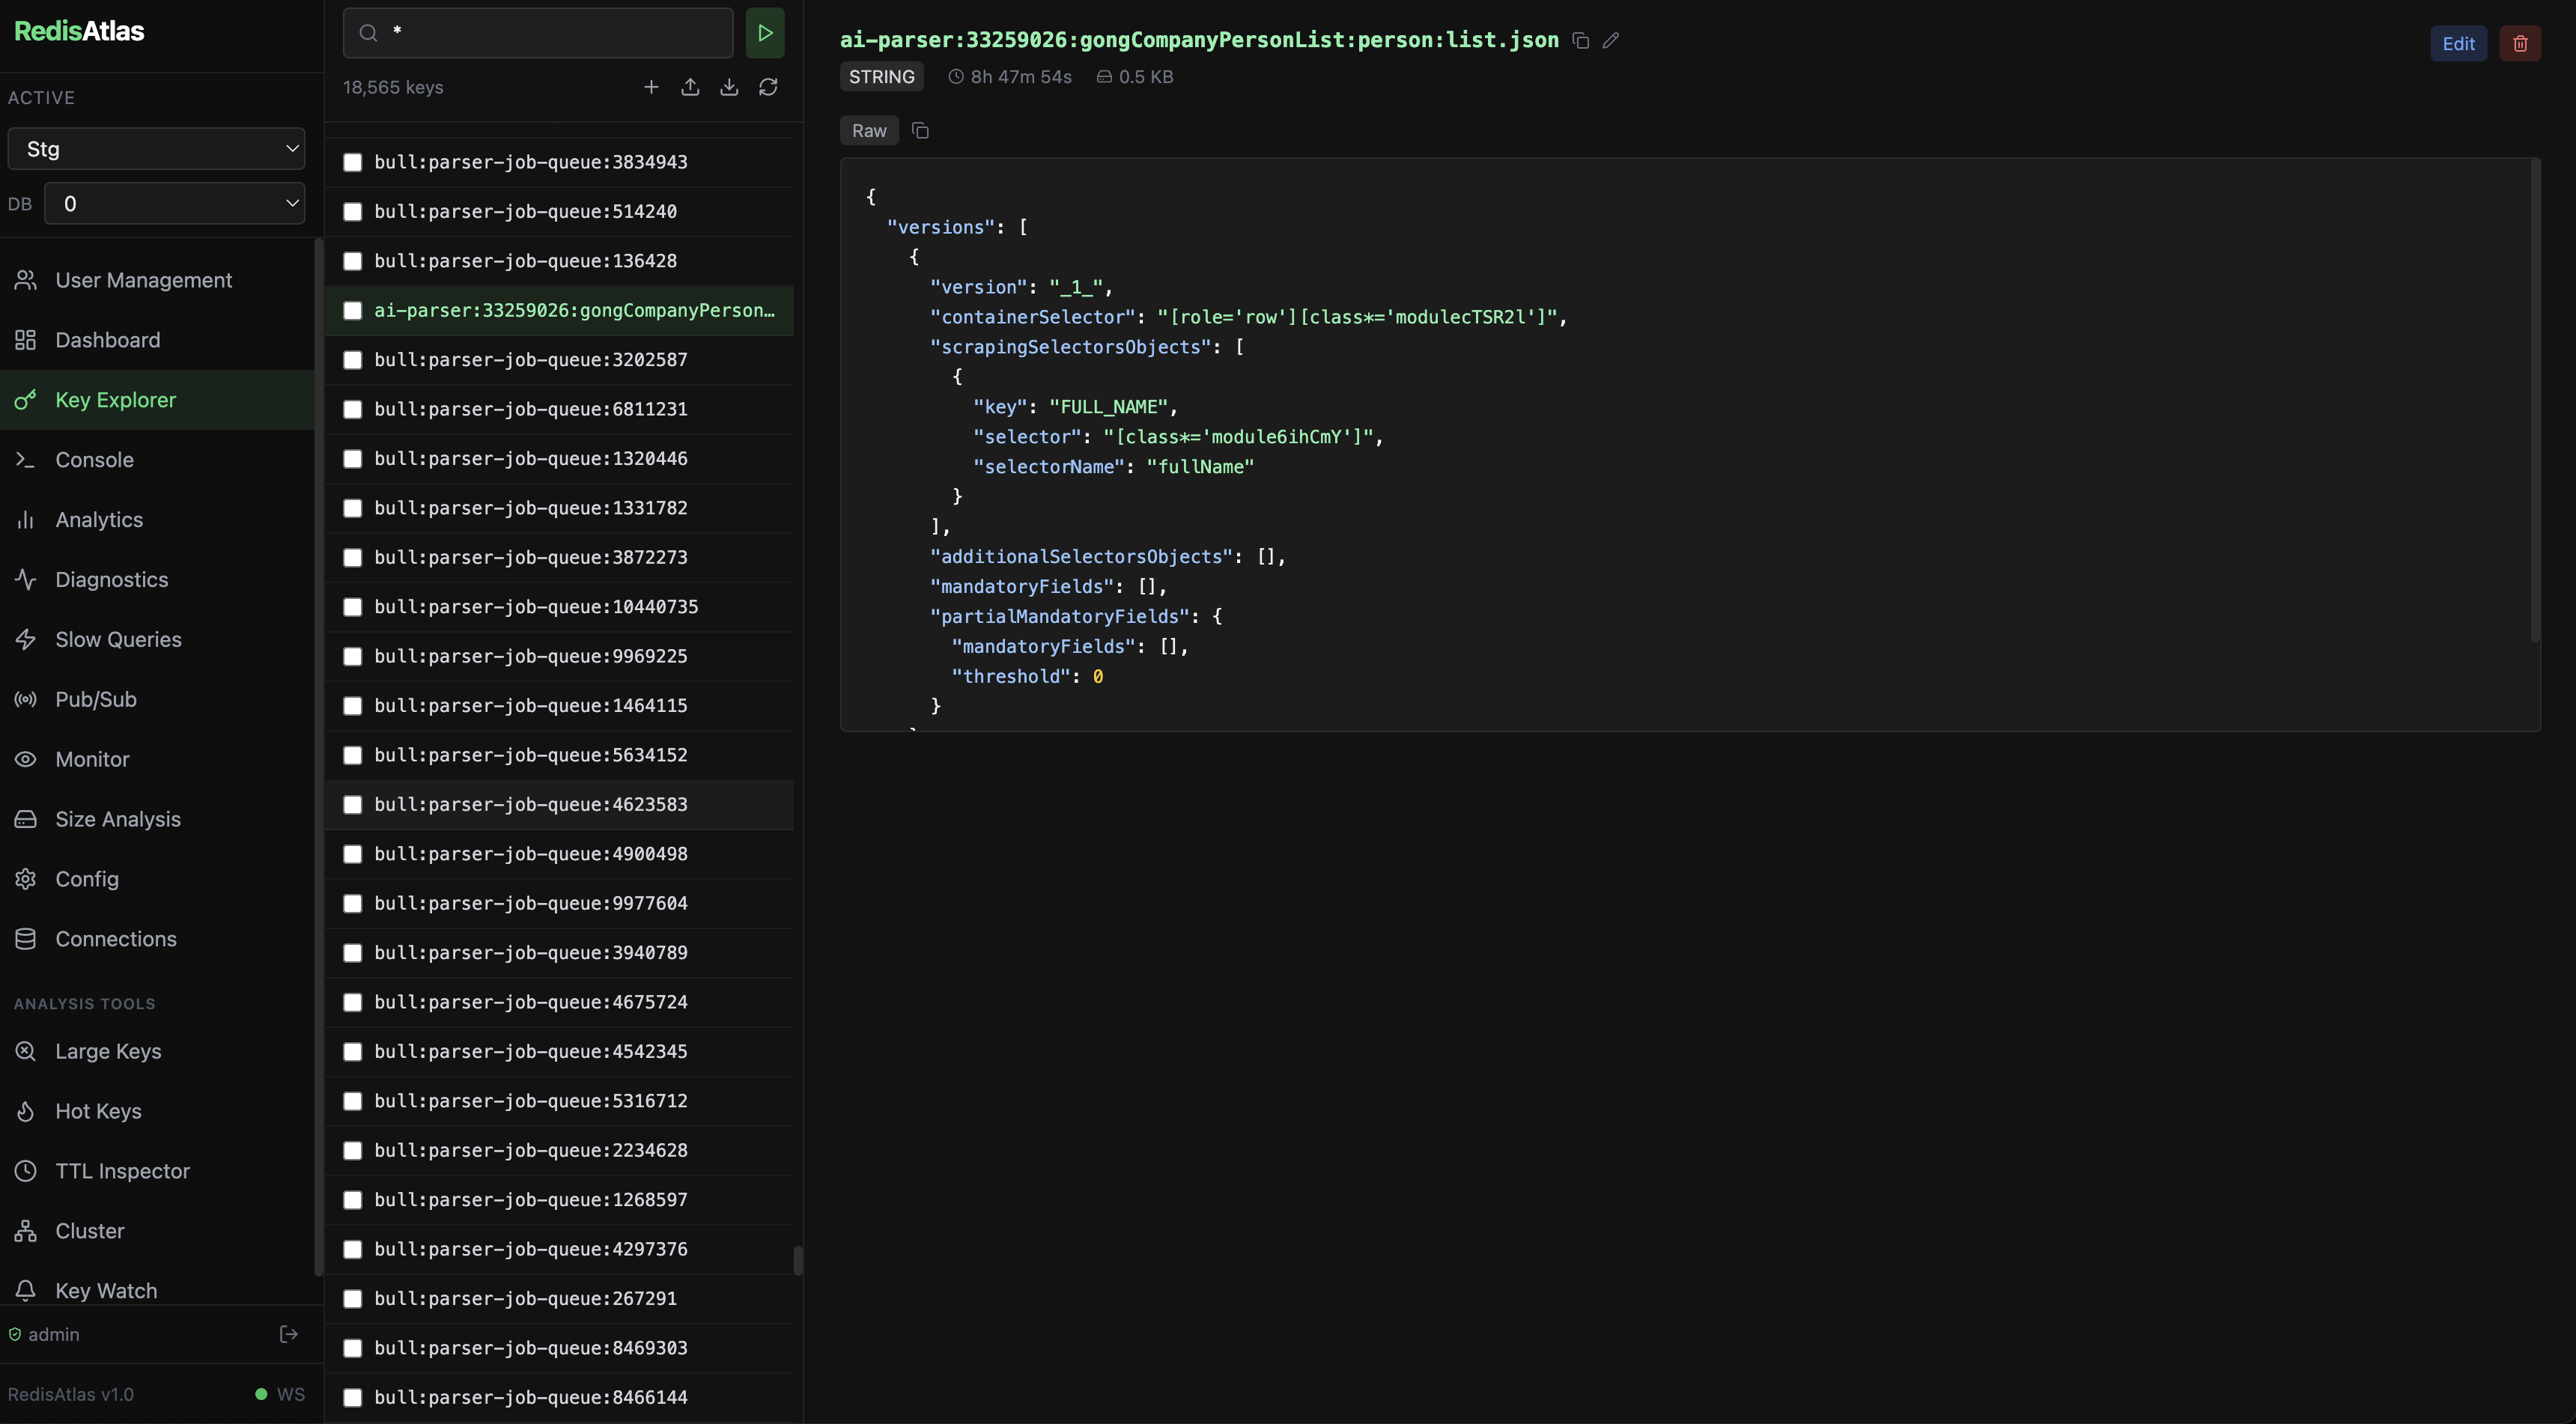
Key Explorer
Browse, search, create, edit, and delete keys with bulk operations. Handles 100M+ keys with cursor-based pagination.
📊
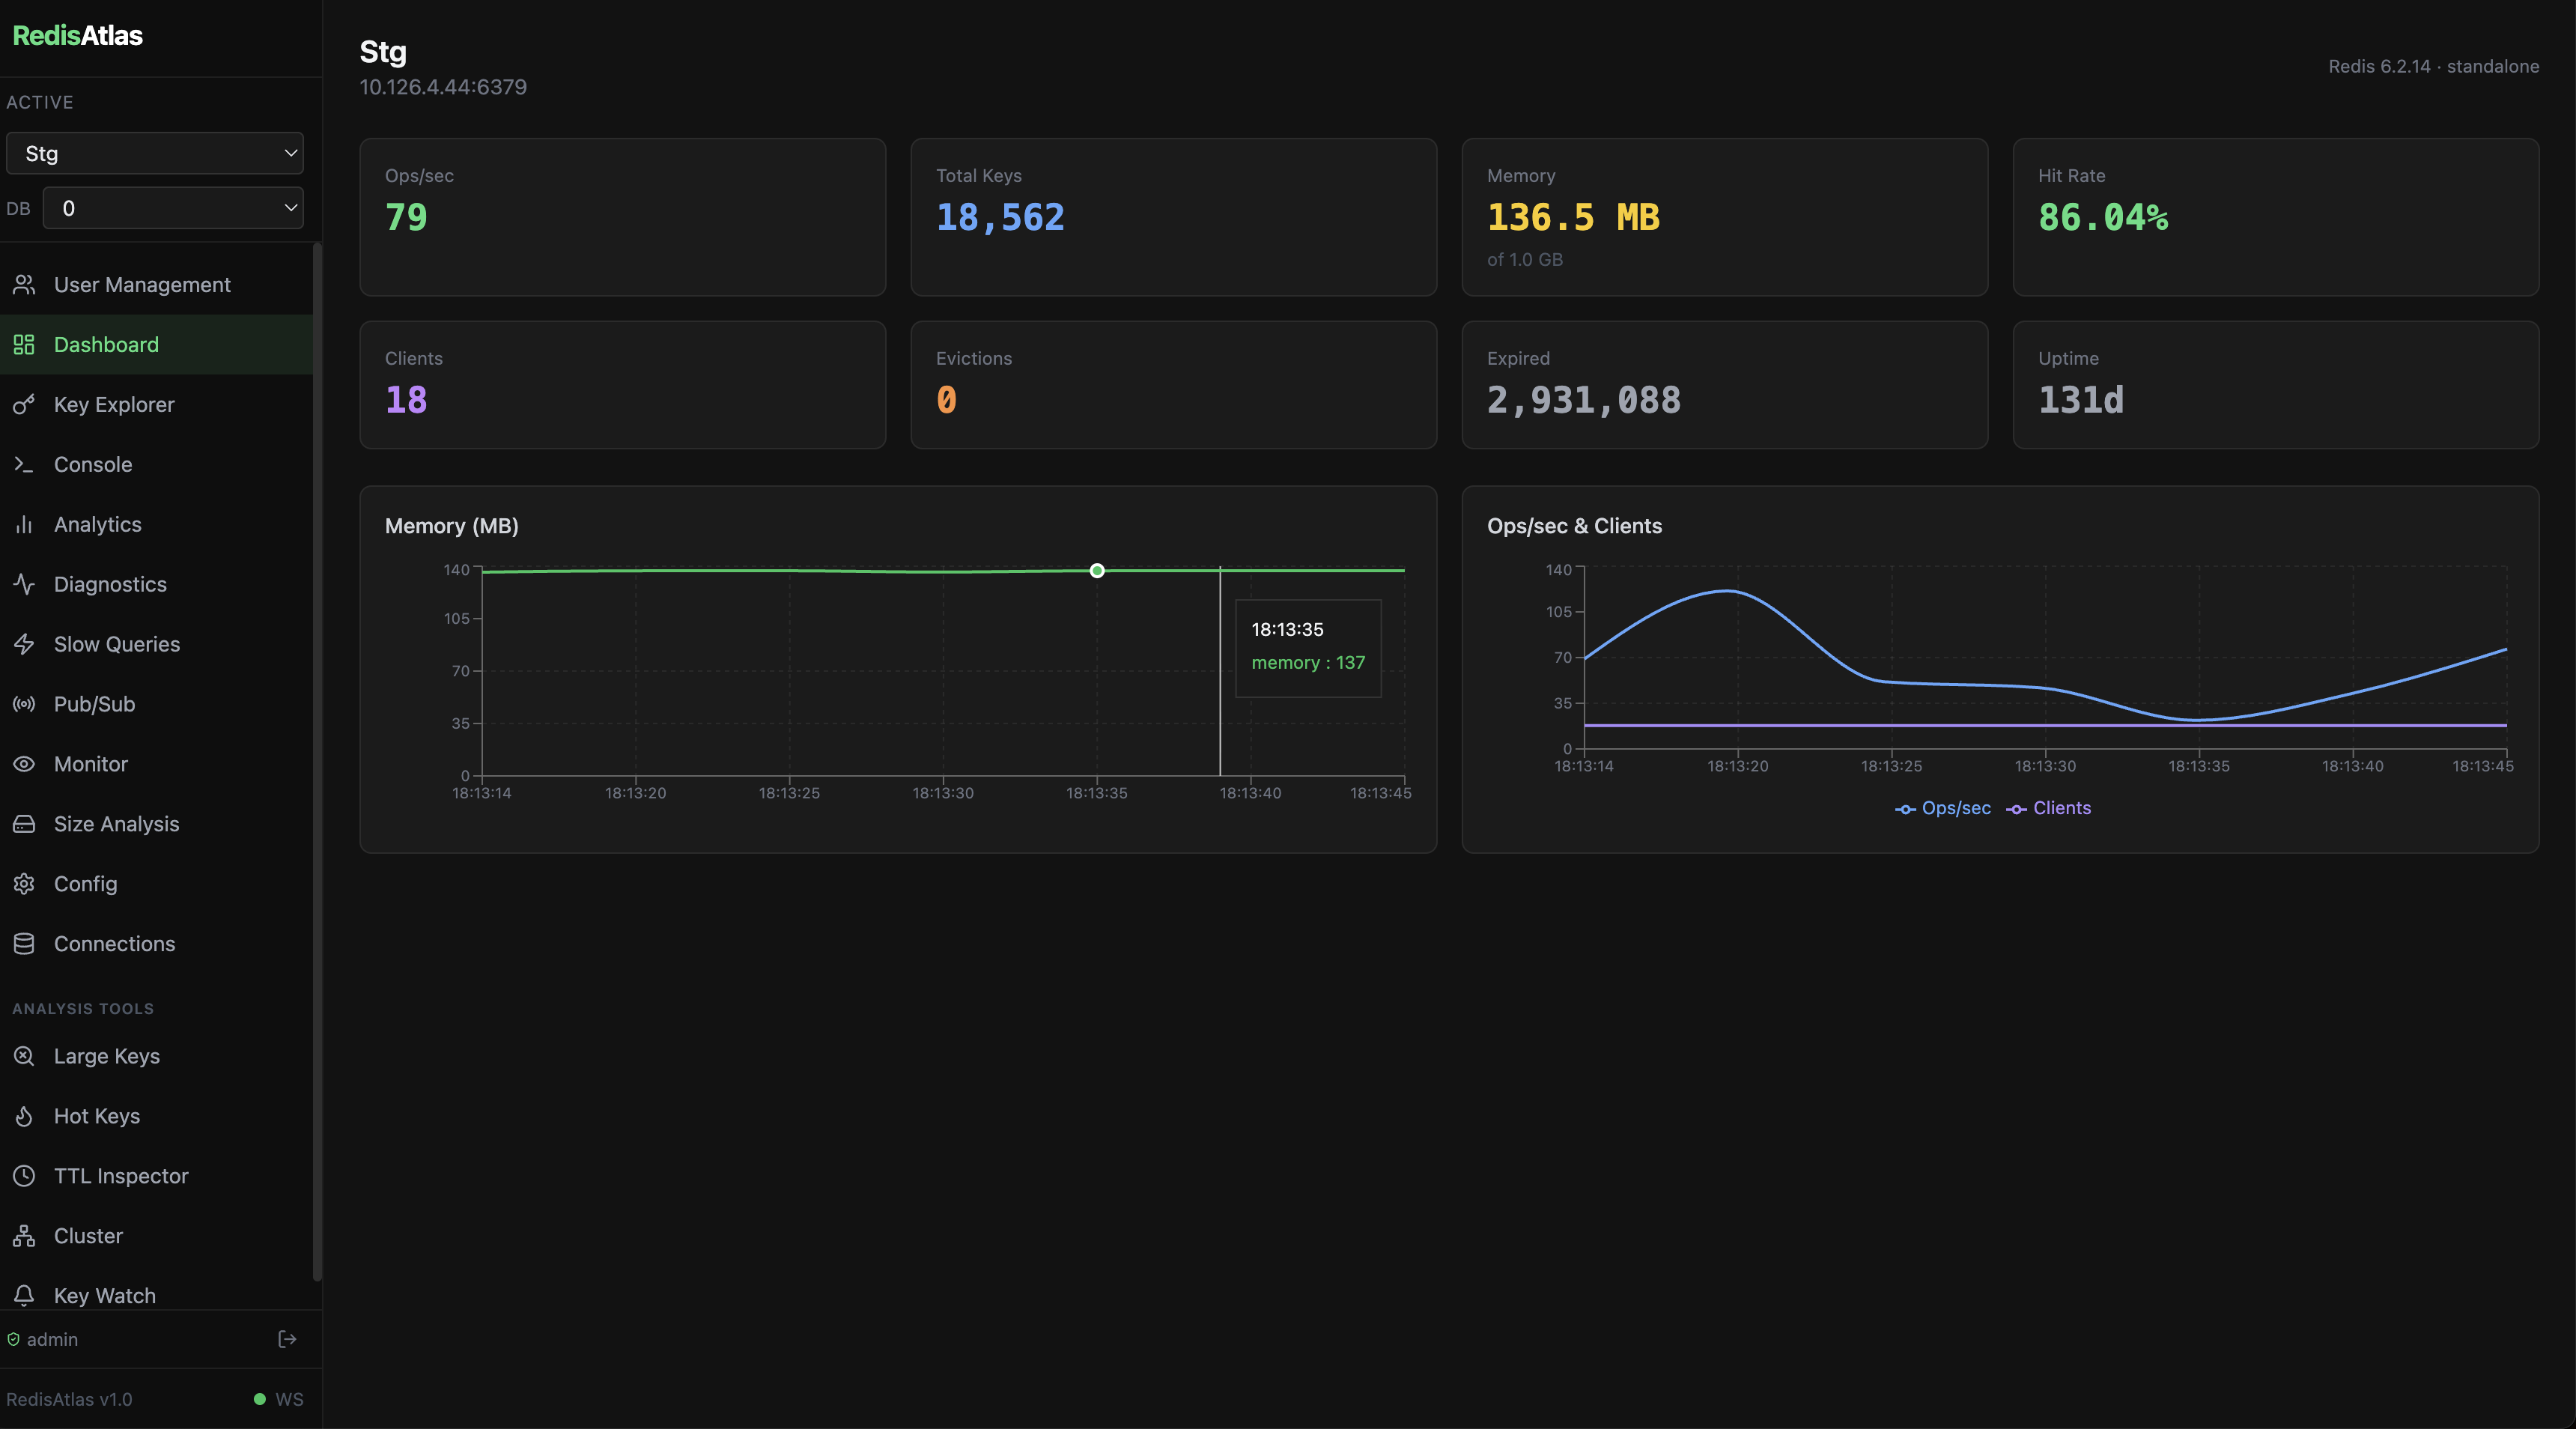
Real-time Dashboard
Live server metrics, memory usage, connected clients, and hit/miss ratios streamed over WebSocket.
💻
Redis Console
Execute raw Redis commands directly with syntax highlighting and command history.
📈
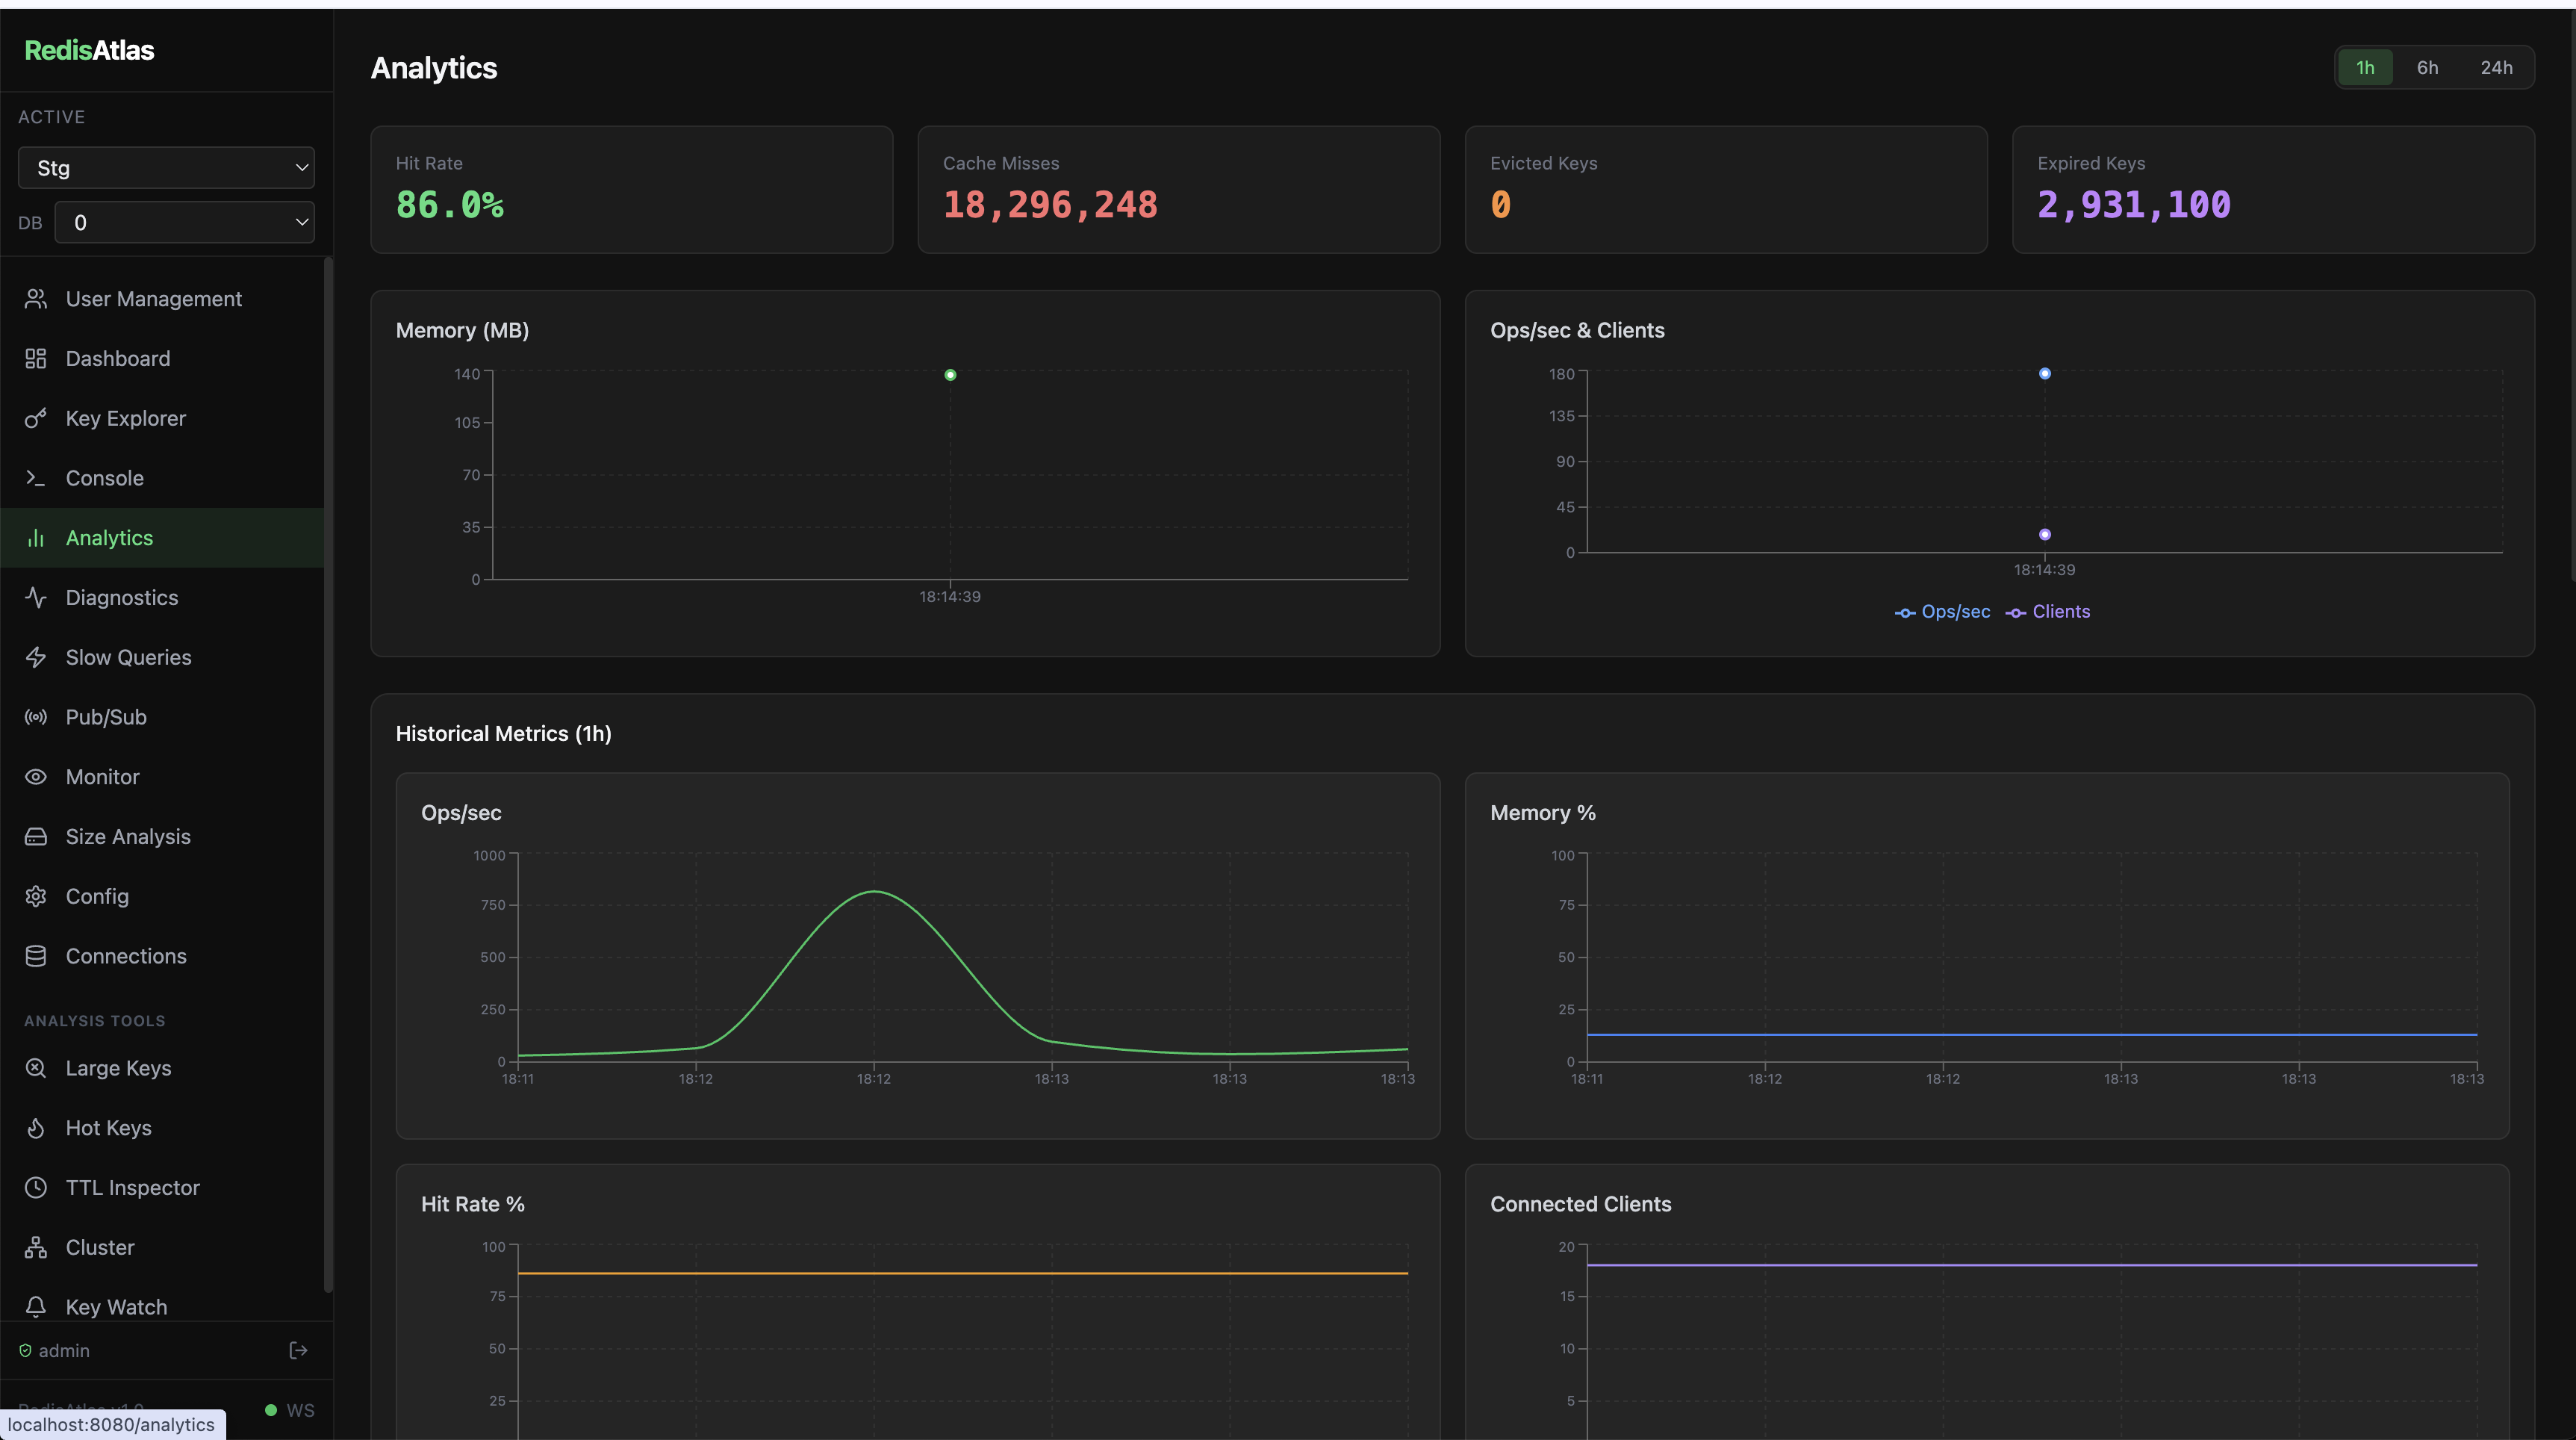
Analytics
Hit rate, eviction trends, namespace breakdown, and 24-hour historical charts (1h / 6h / 24h) with interactive time-range selection.
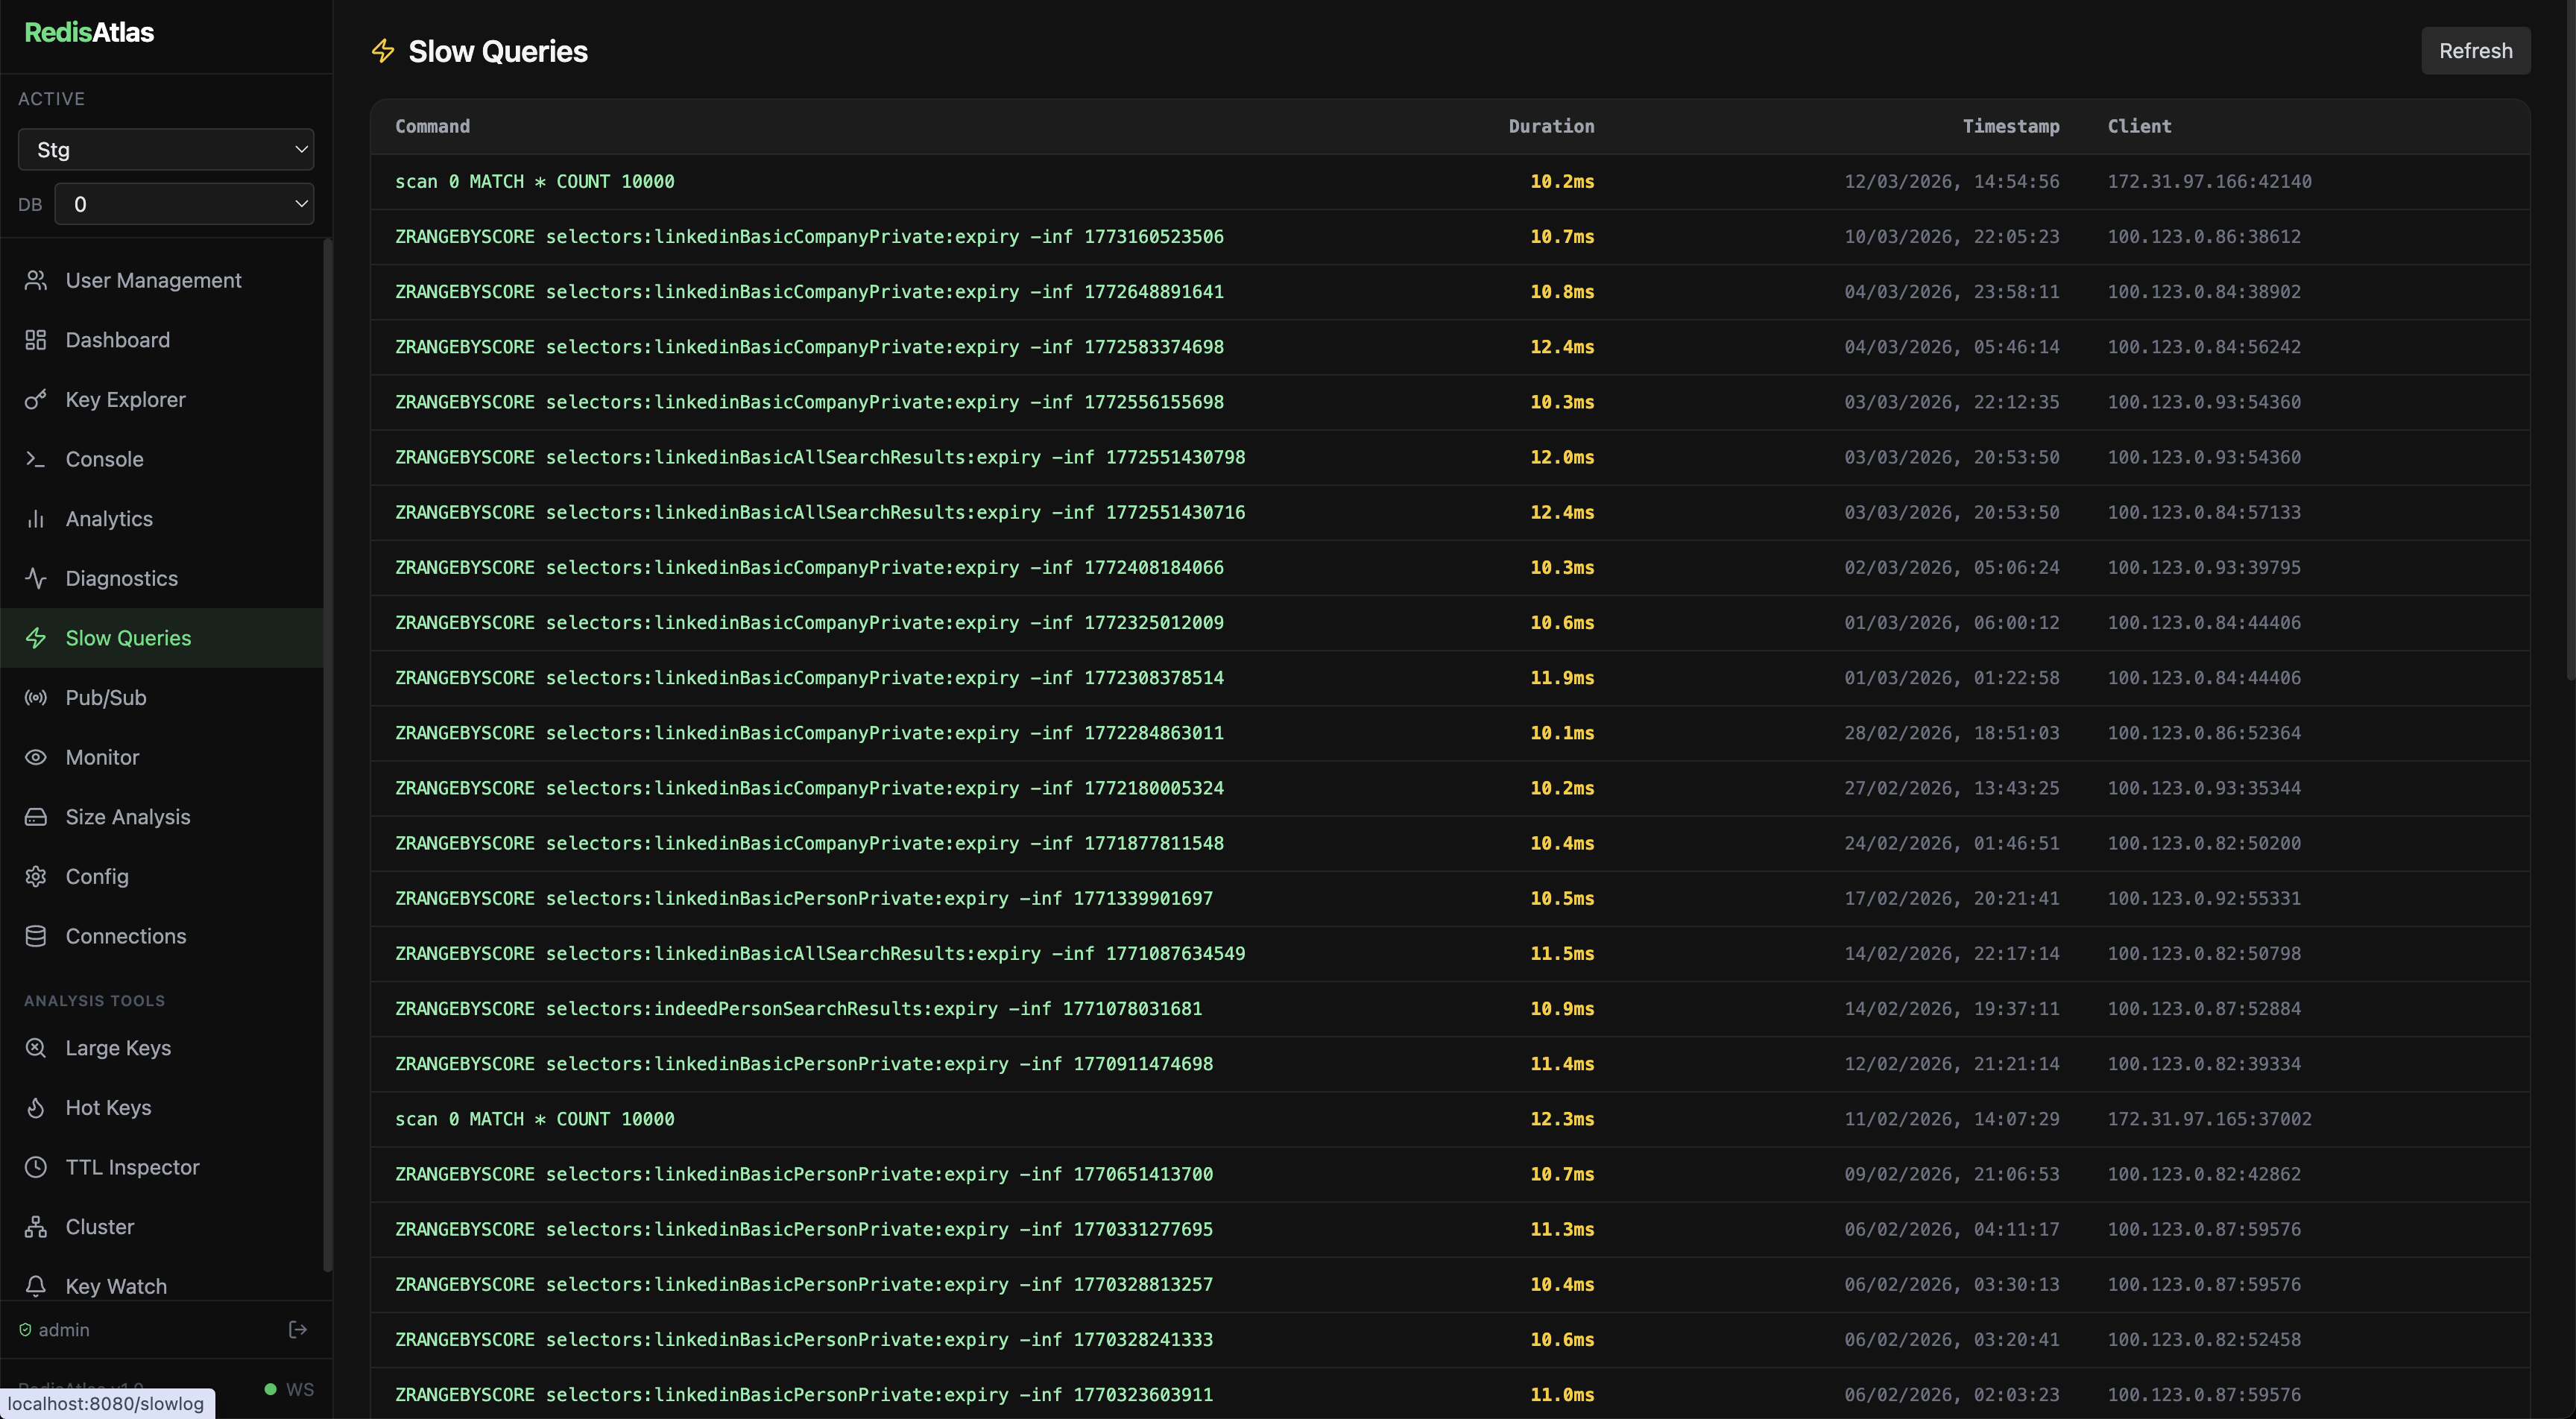
🐢
Slow Log
Visualize slow queries, identify bottlenecks, and optimize your Redis usage.
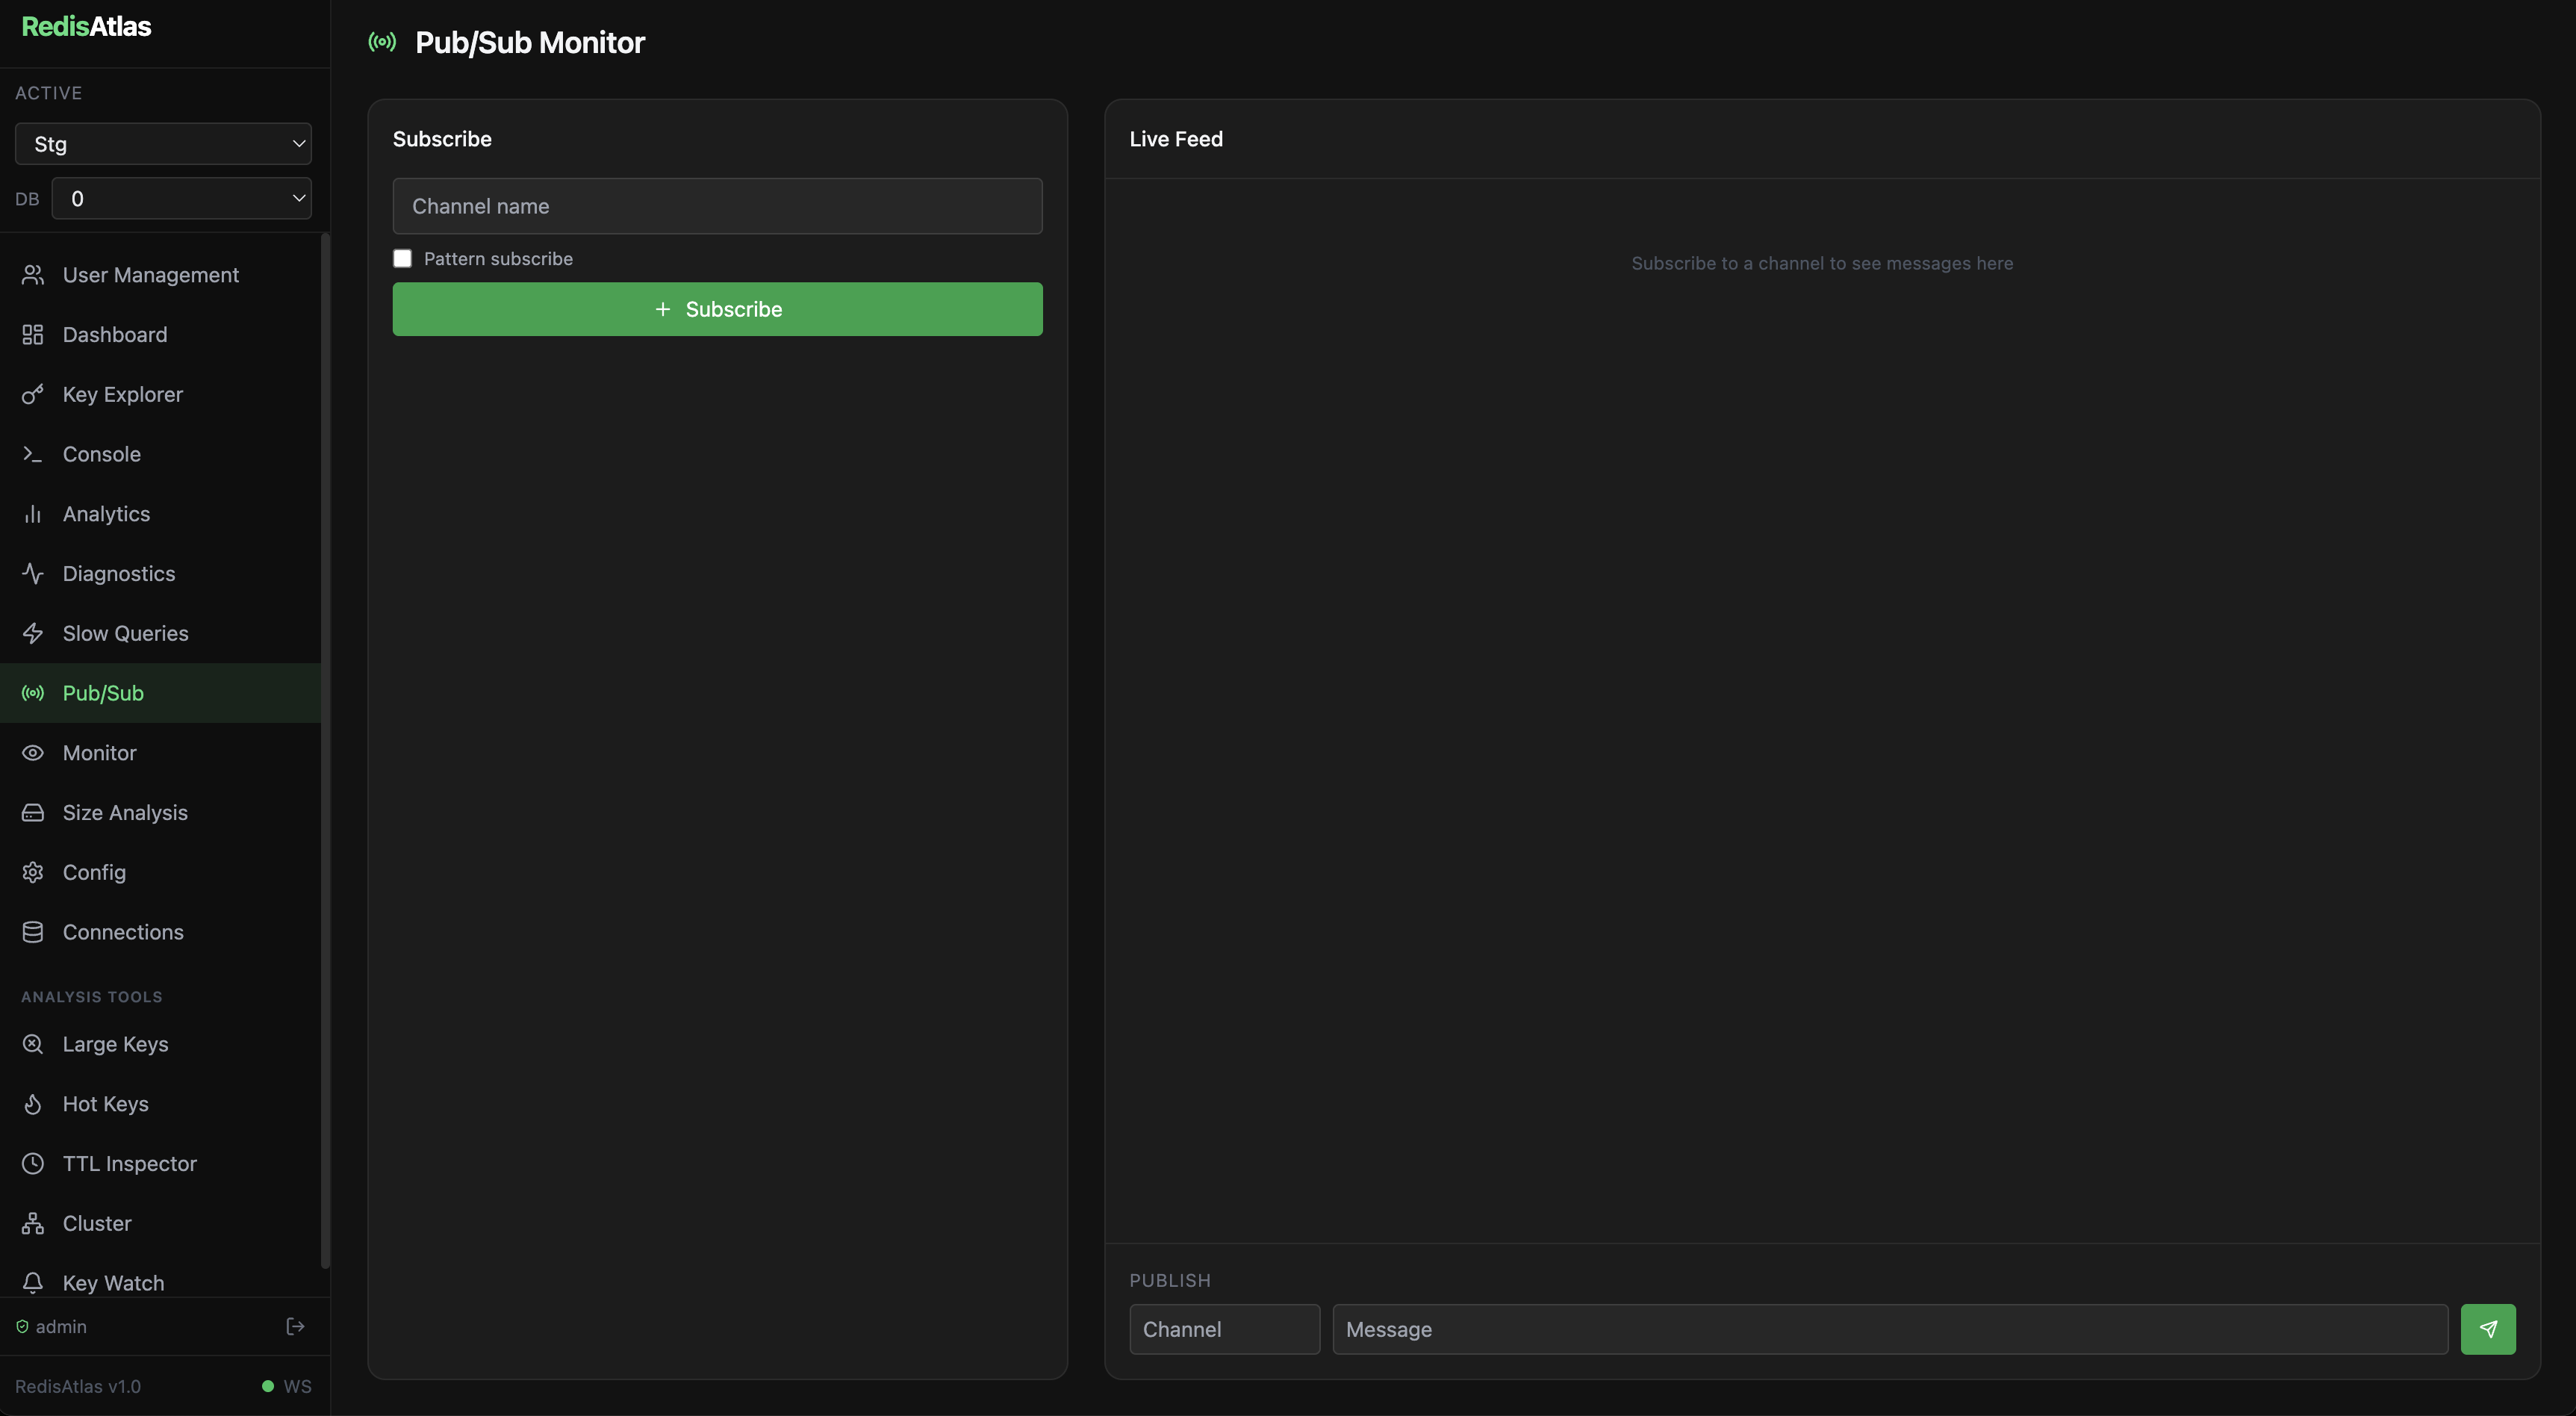
📡
Pub/Sub
Publish messages and subscribe to channels and patterns in real time from the browser.
📦
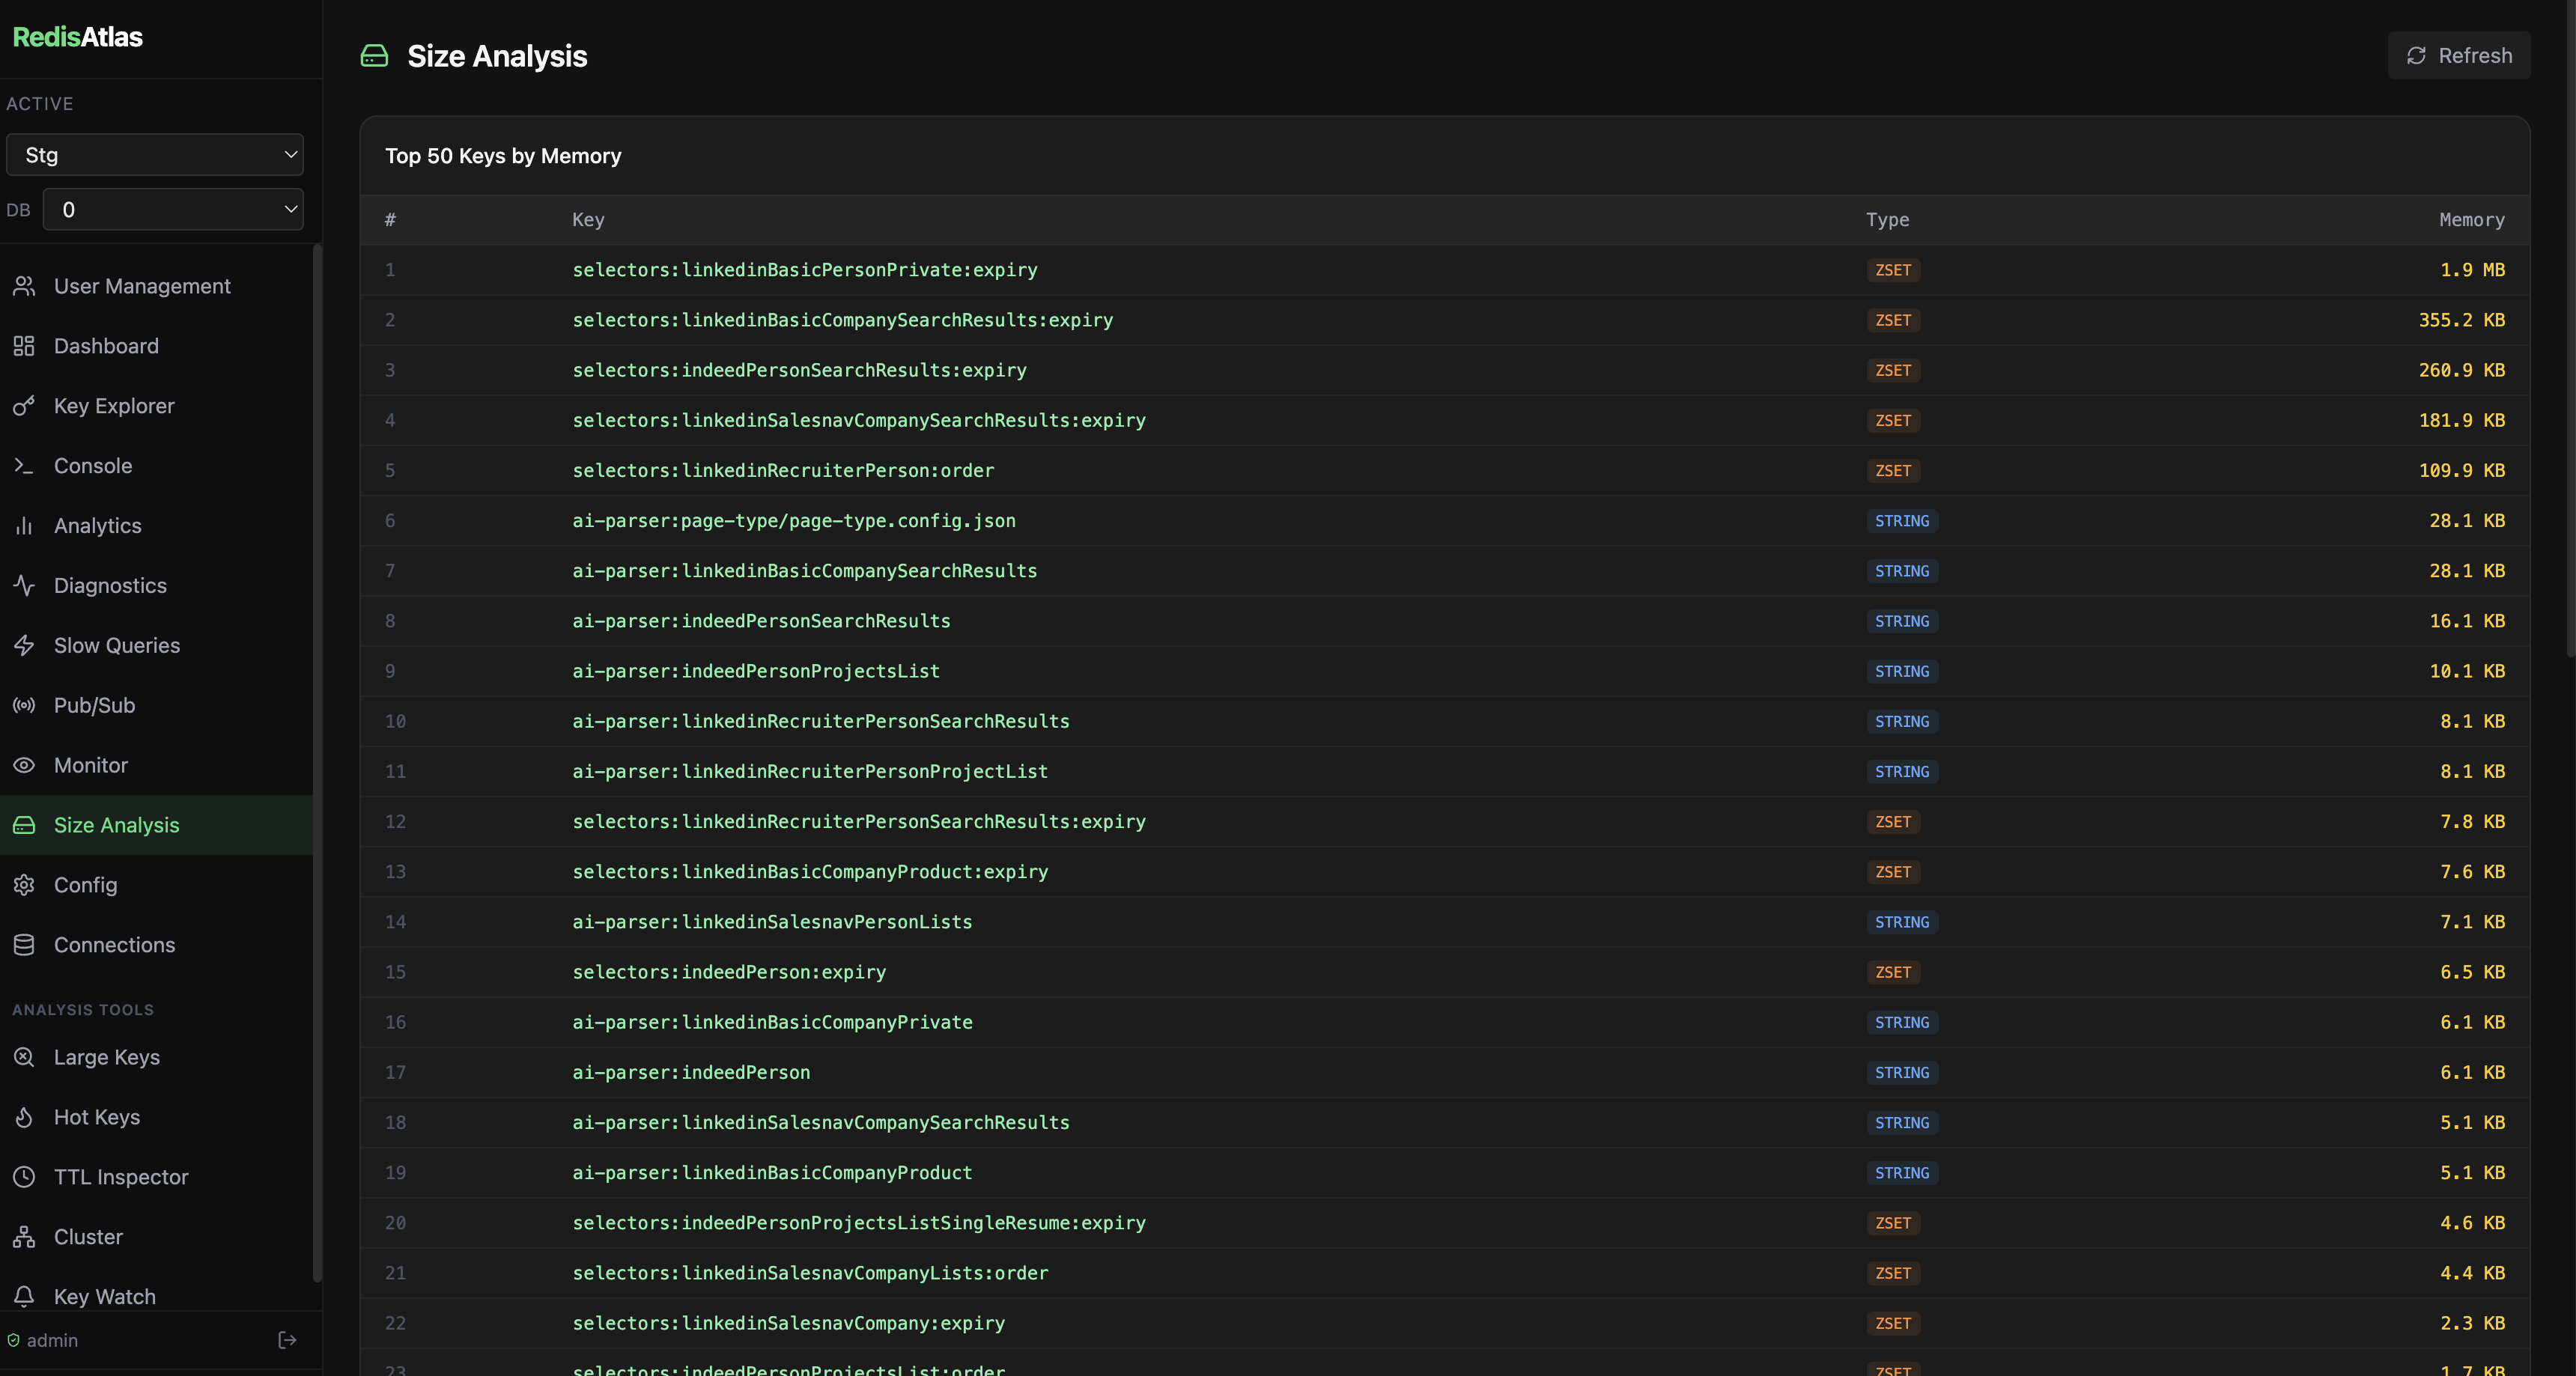
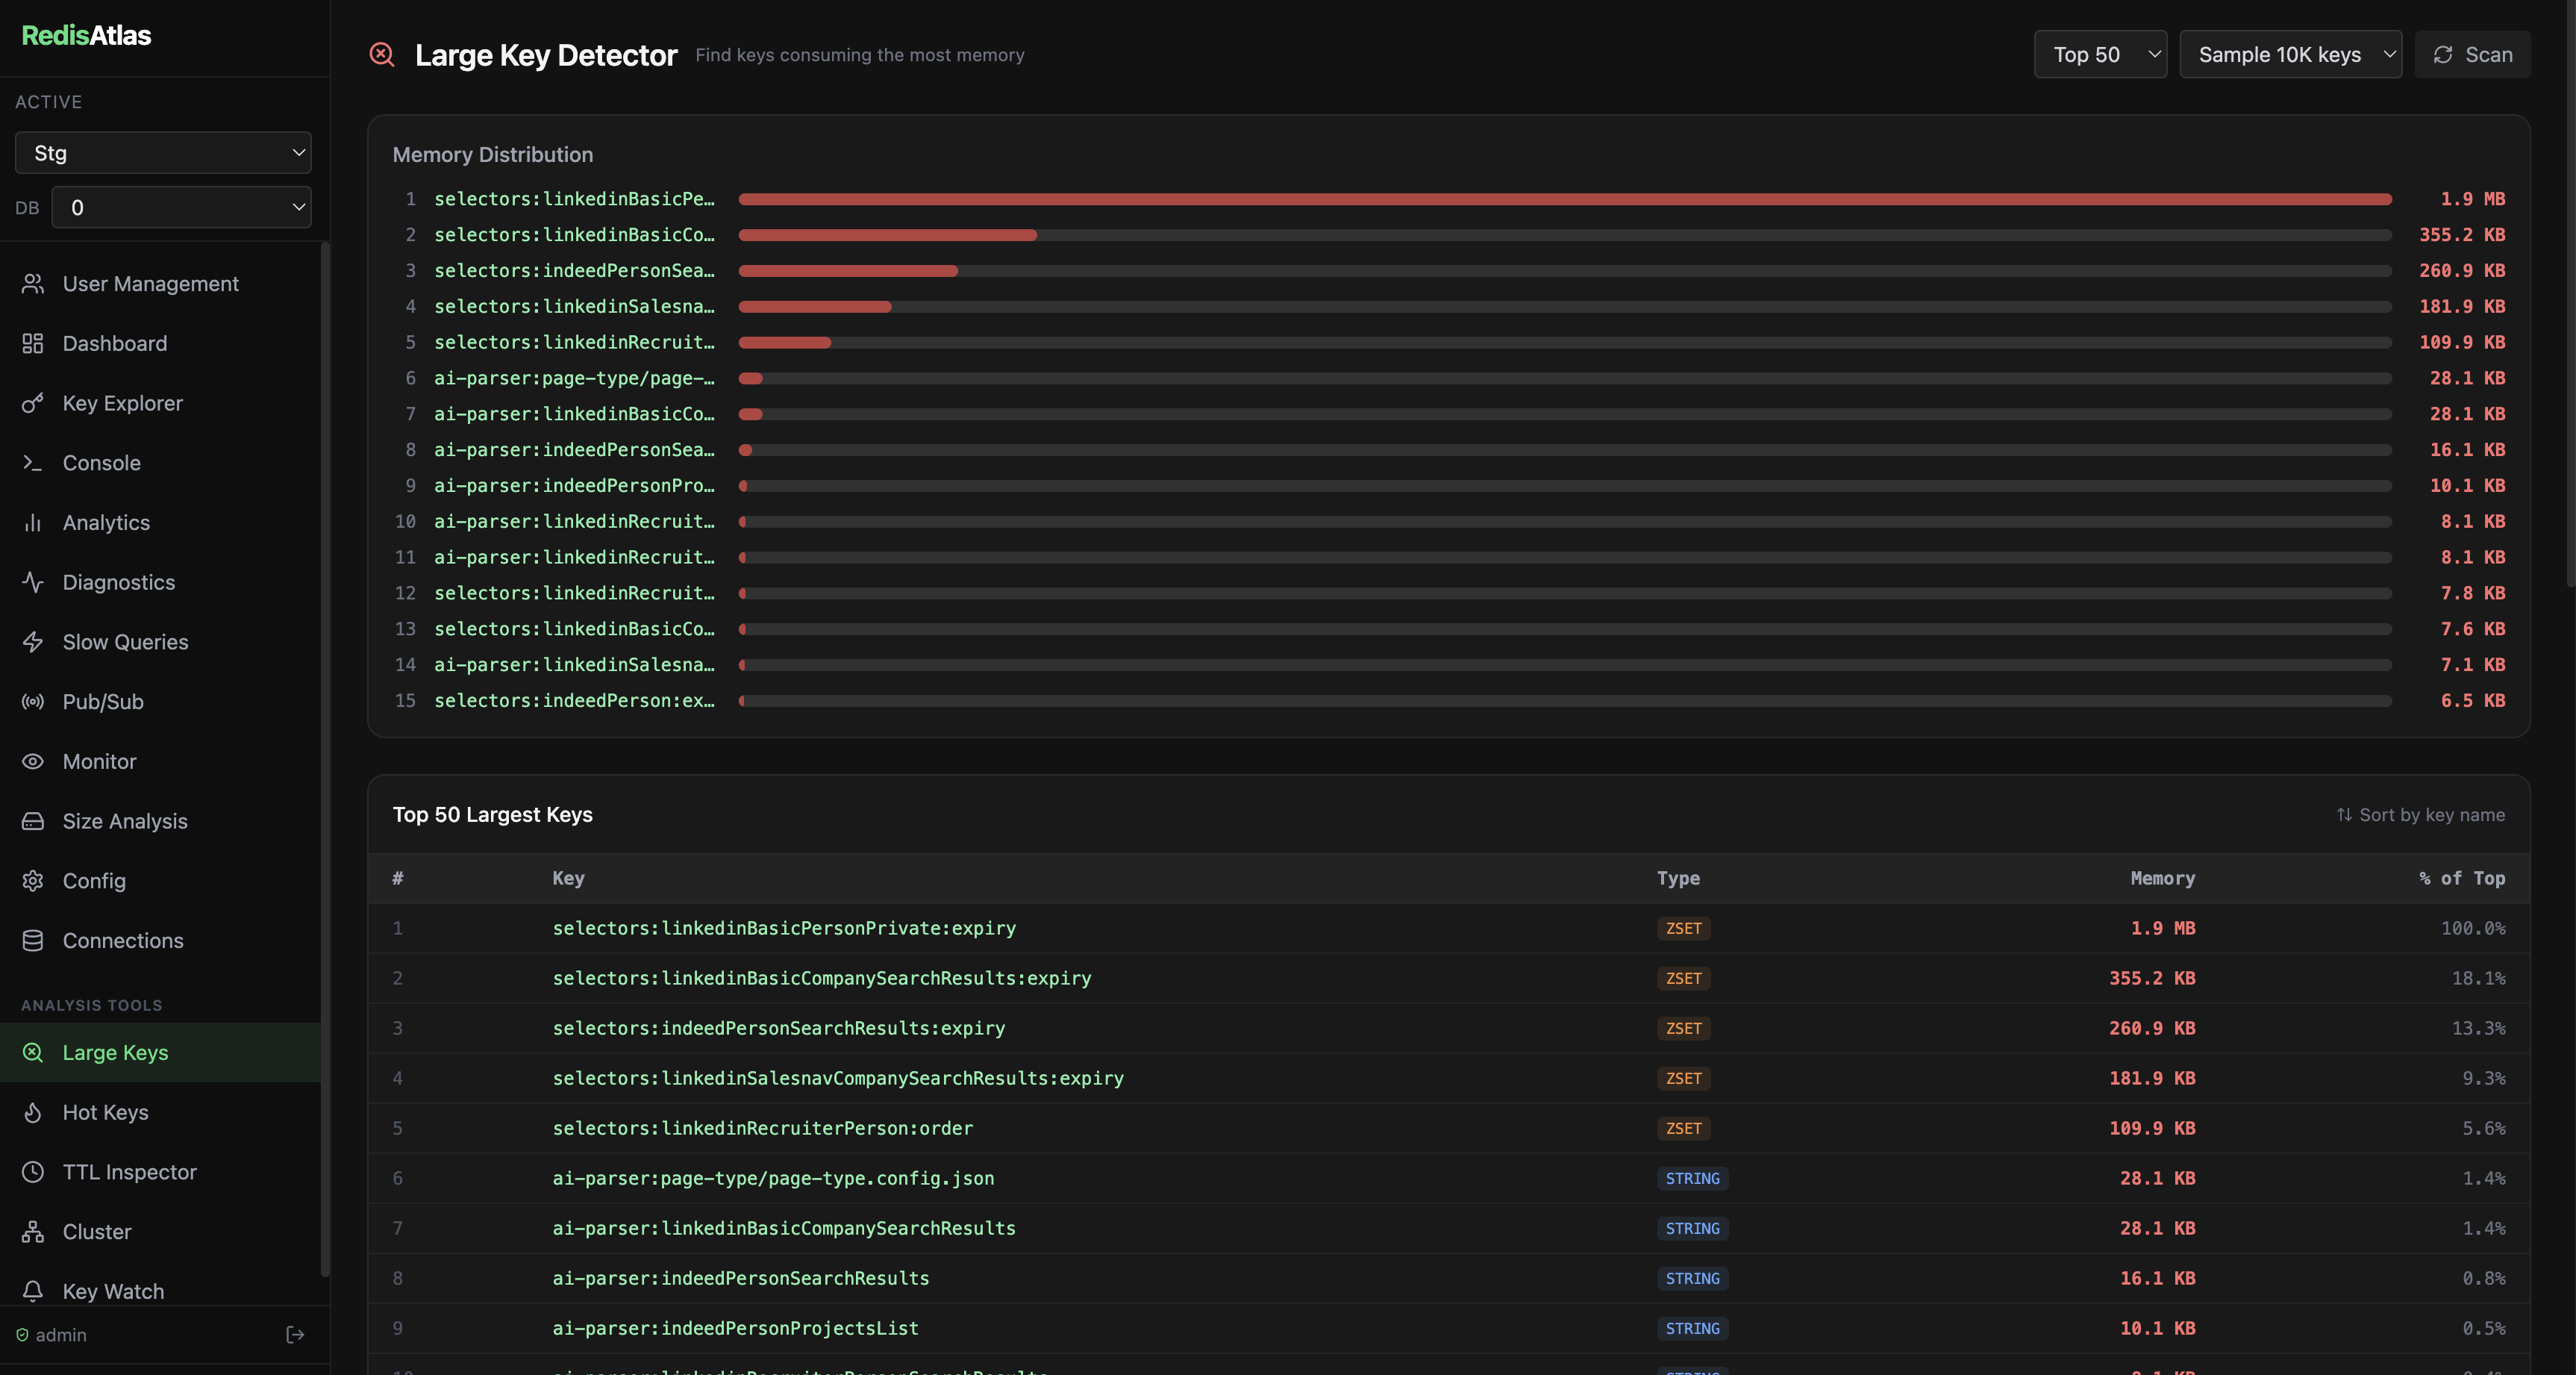
Size Analysis
Find your biggest keys and memory hogs. Understand what's consuming your Redis memory.
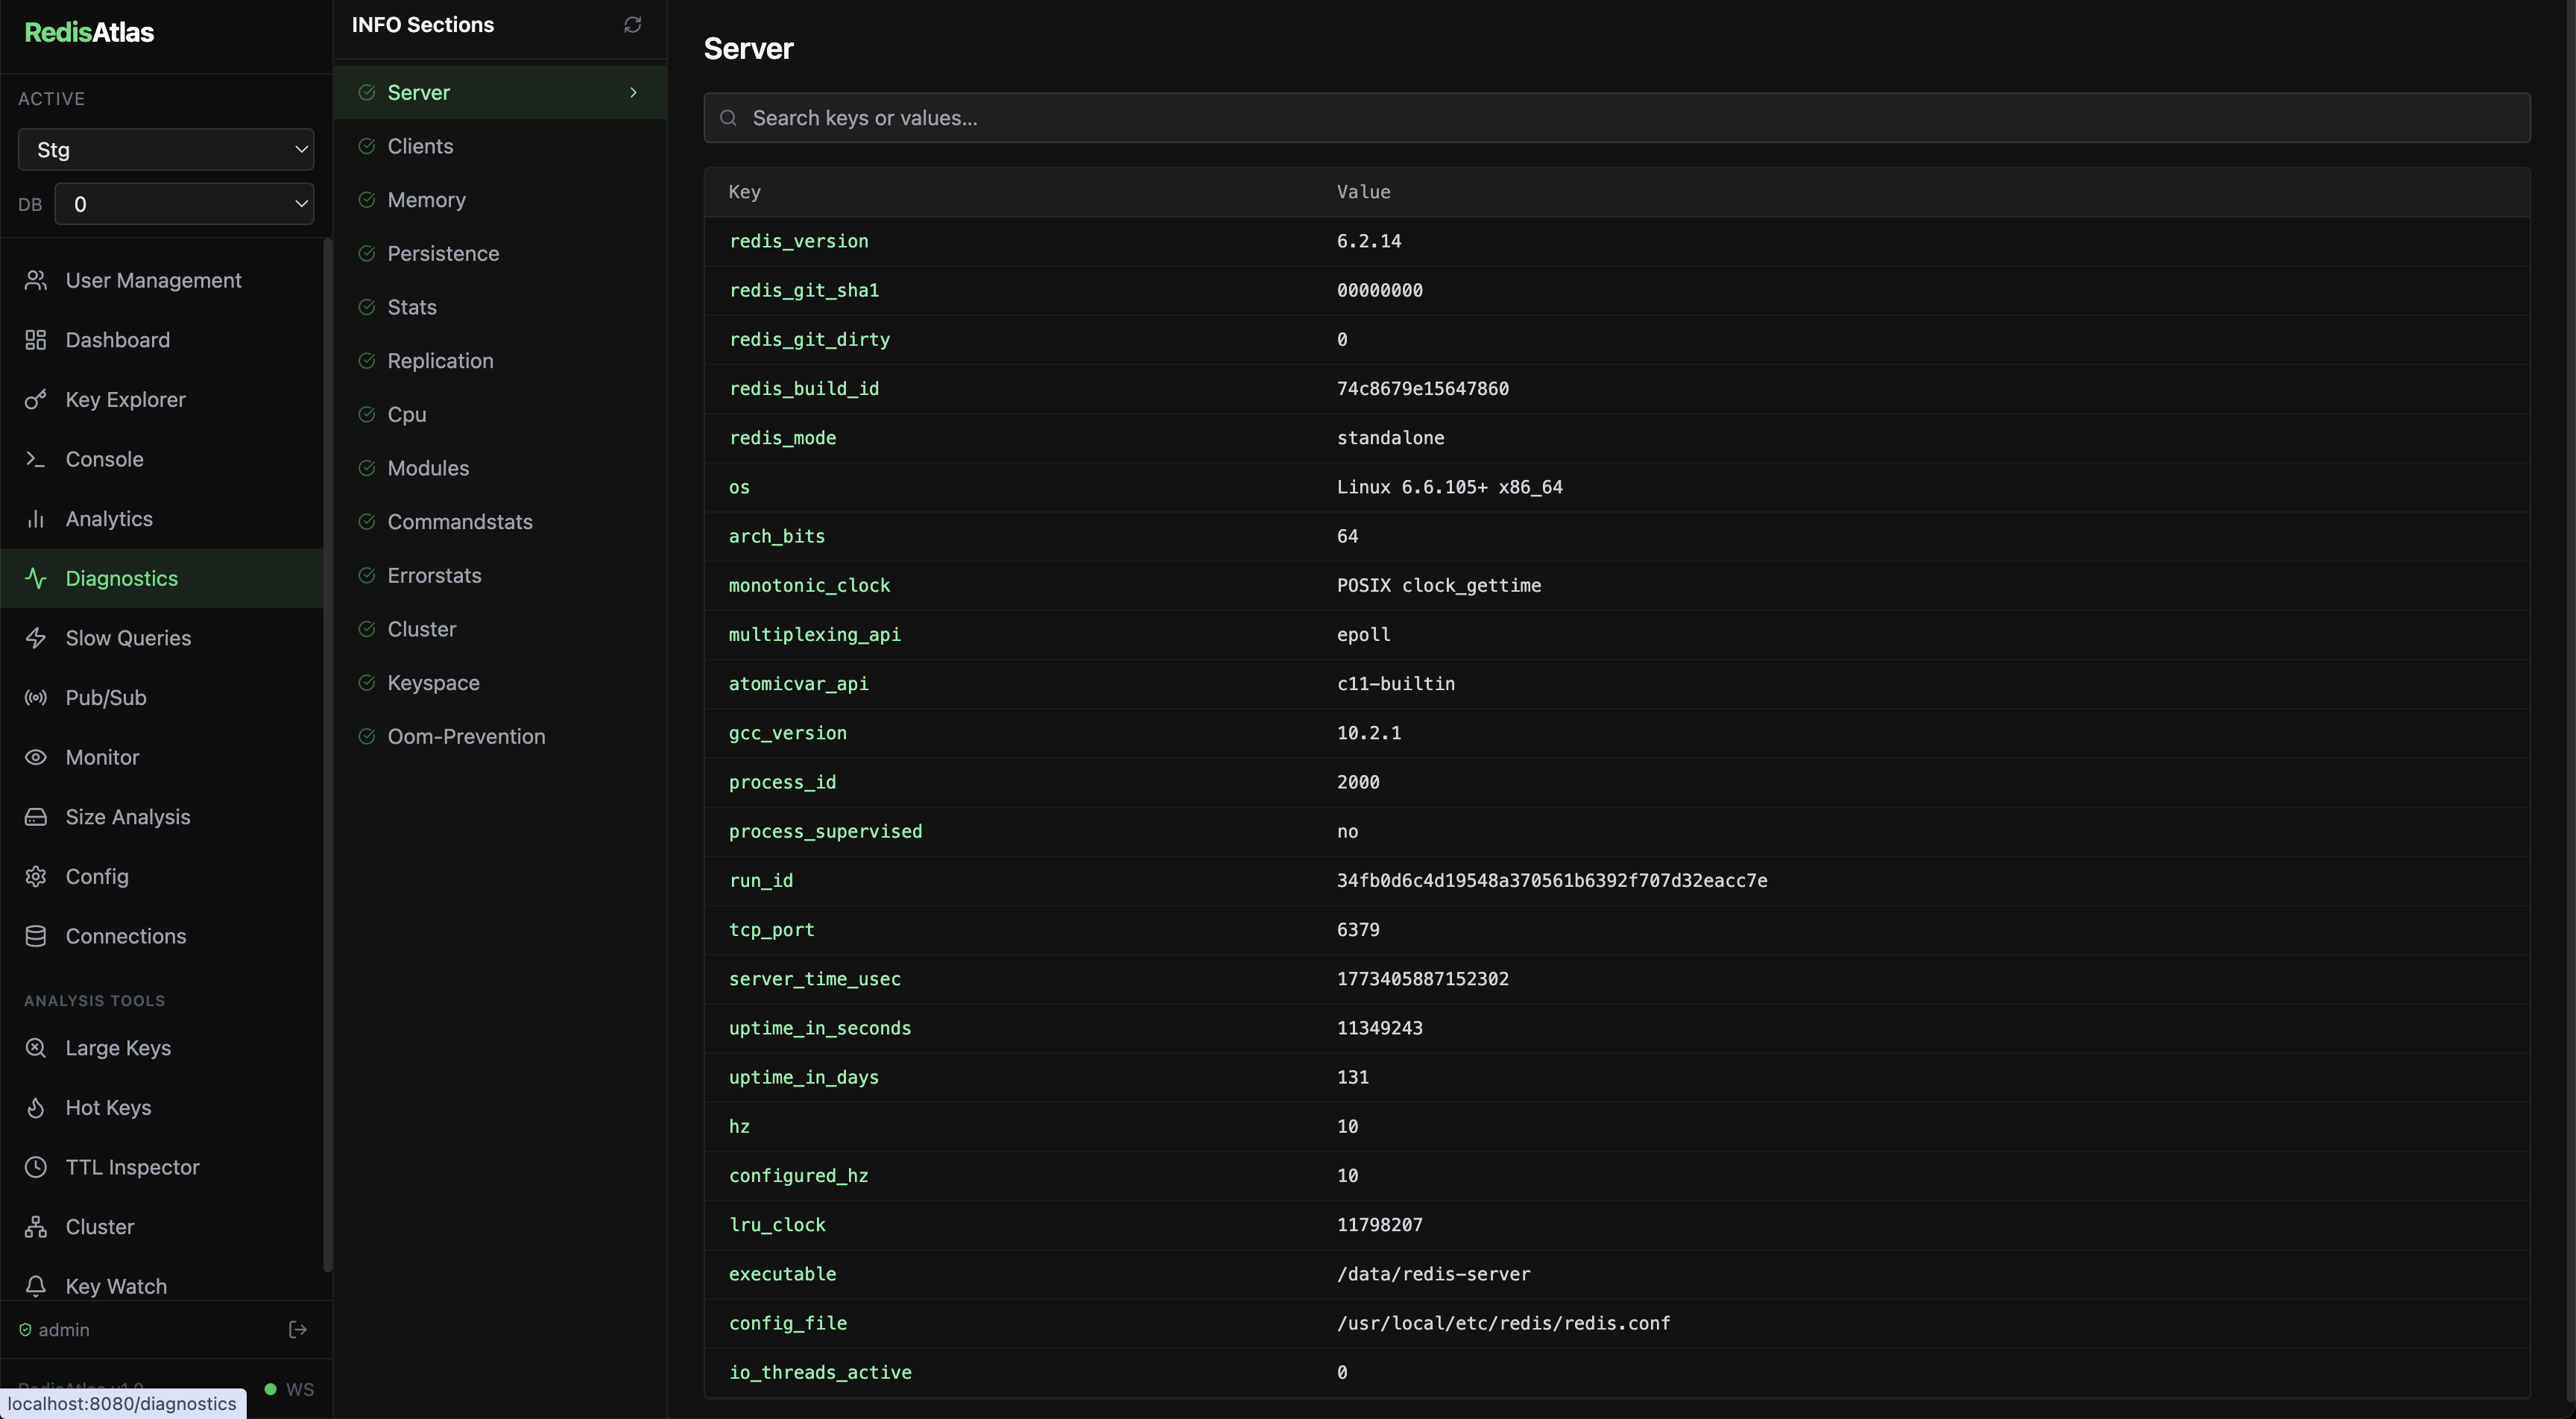
🩺
Diagnostics
Full INFO ALL viewer across all sections with health indicators. Admin-only BGSAVE & BGREWRITEAOF triggers.
📥
Key Import
Import keys from JSON, CSV, or Redis command files with a 5-entry preview and overwrite control.
✏️
Rich Type Editors
Inline add / edit / delete for individual Hash fields, List items, Set members, and ZSet scores — no full-key rewrites.
🖥️
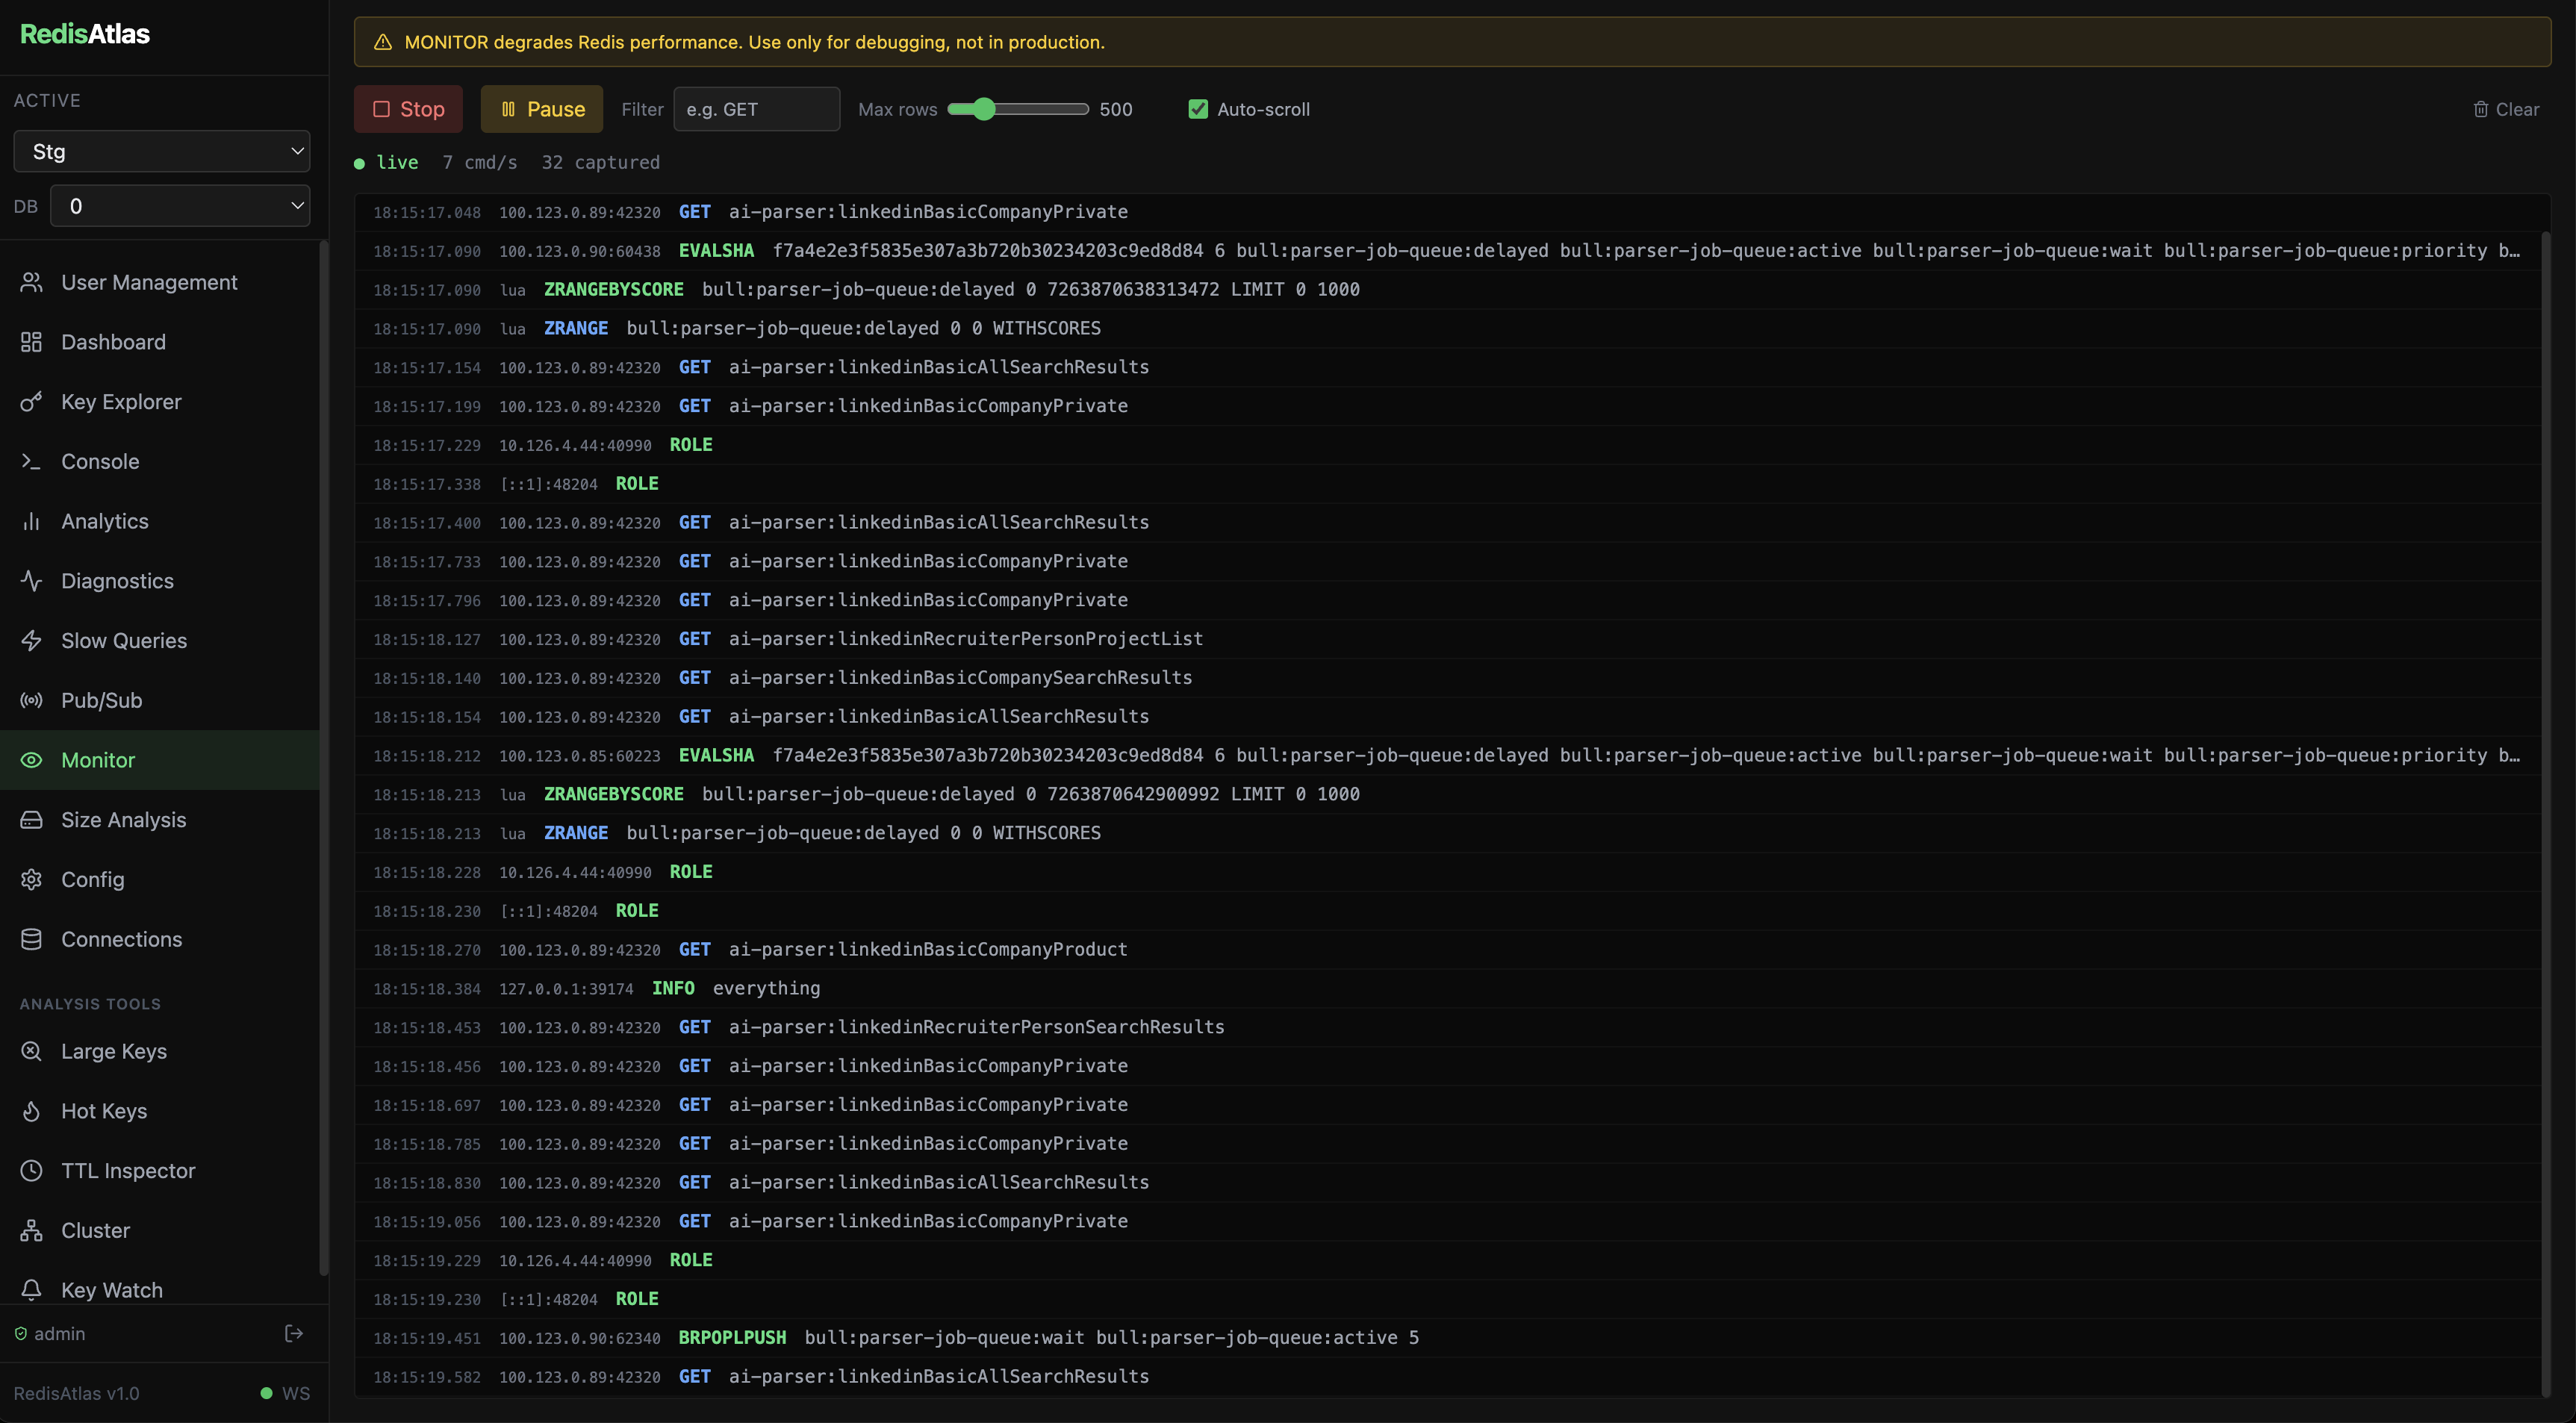
Live Monitor
Stream every Redis command in real time. Filter by command, pause/resume feed, track cmd/s. Color-coded by operation type.
🔔
Key Watch
Watch key patterns for keyspace notification events — set, del, expired, hset, and more — streamed live via WebSocket.
🔗
Multi-Connection
Manage multiple Redis servers simultaneously from a single interface.
👥
User Management
Role-based access control with admin and viewer roles. Invite team members securely.
🔒
HTTP & HTTPS
Auto-detects cert mount and switches modes. Works plain HTTP out of the box, TLS when certs are provided.
⚙️
Config Editor
Inspect and edit the full Redis server configuration inline. Type-aware inputs, dangerous-param warnings, session change history. Admin write, viewer read-only.
🌊
Streams Explorer
Full Redis Streams UI — browse entries, manage consumer groups, inspect pending messages, and ACK from the browser.
🌿
Key Patterns
Namespace tree-view with key counts, memory usage bars, and one-click drill-down to the Key Explorer with a pre-set match filter.
♻️
Replication
Master/replica topology with per-replica lag gauge, sync state, native lag, and replication offset delta — refreshes every 5s.
🛡️
Persistence Health
RDB and AOF status with last-save age, bgsave in-progress detection, AOF rewrite status, and RPO estimate with color-coded freshness.
💻
Client Tracker
Live list of all connected clients with blocked-client alerts, flag decoder, idle time, and address/command filters.
📊
Command Stats
Top-15 command breakdown from COMMANDSTATS — horizontal bar chart ranked by call count with µs-per-call tooltip.
⚡
Latency Events
LATENCY LATEST table showing event name, latest latency (ms), all-time max, and color-coded health: green <1ms, yellow <10ms, red >10ms.
⏱️
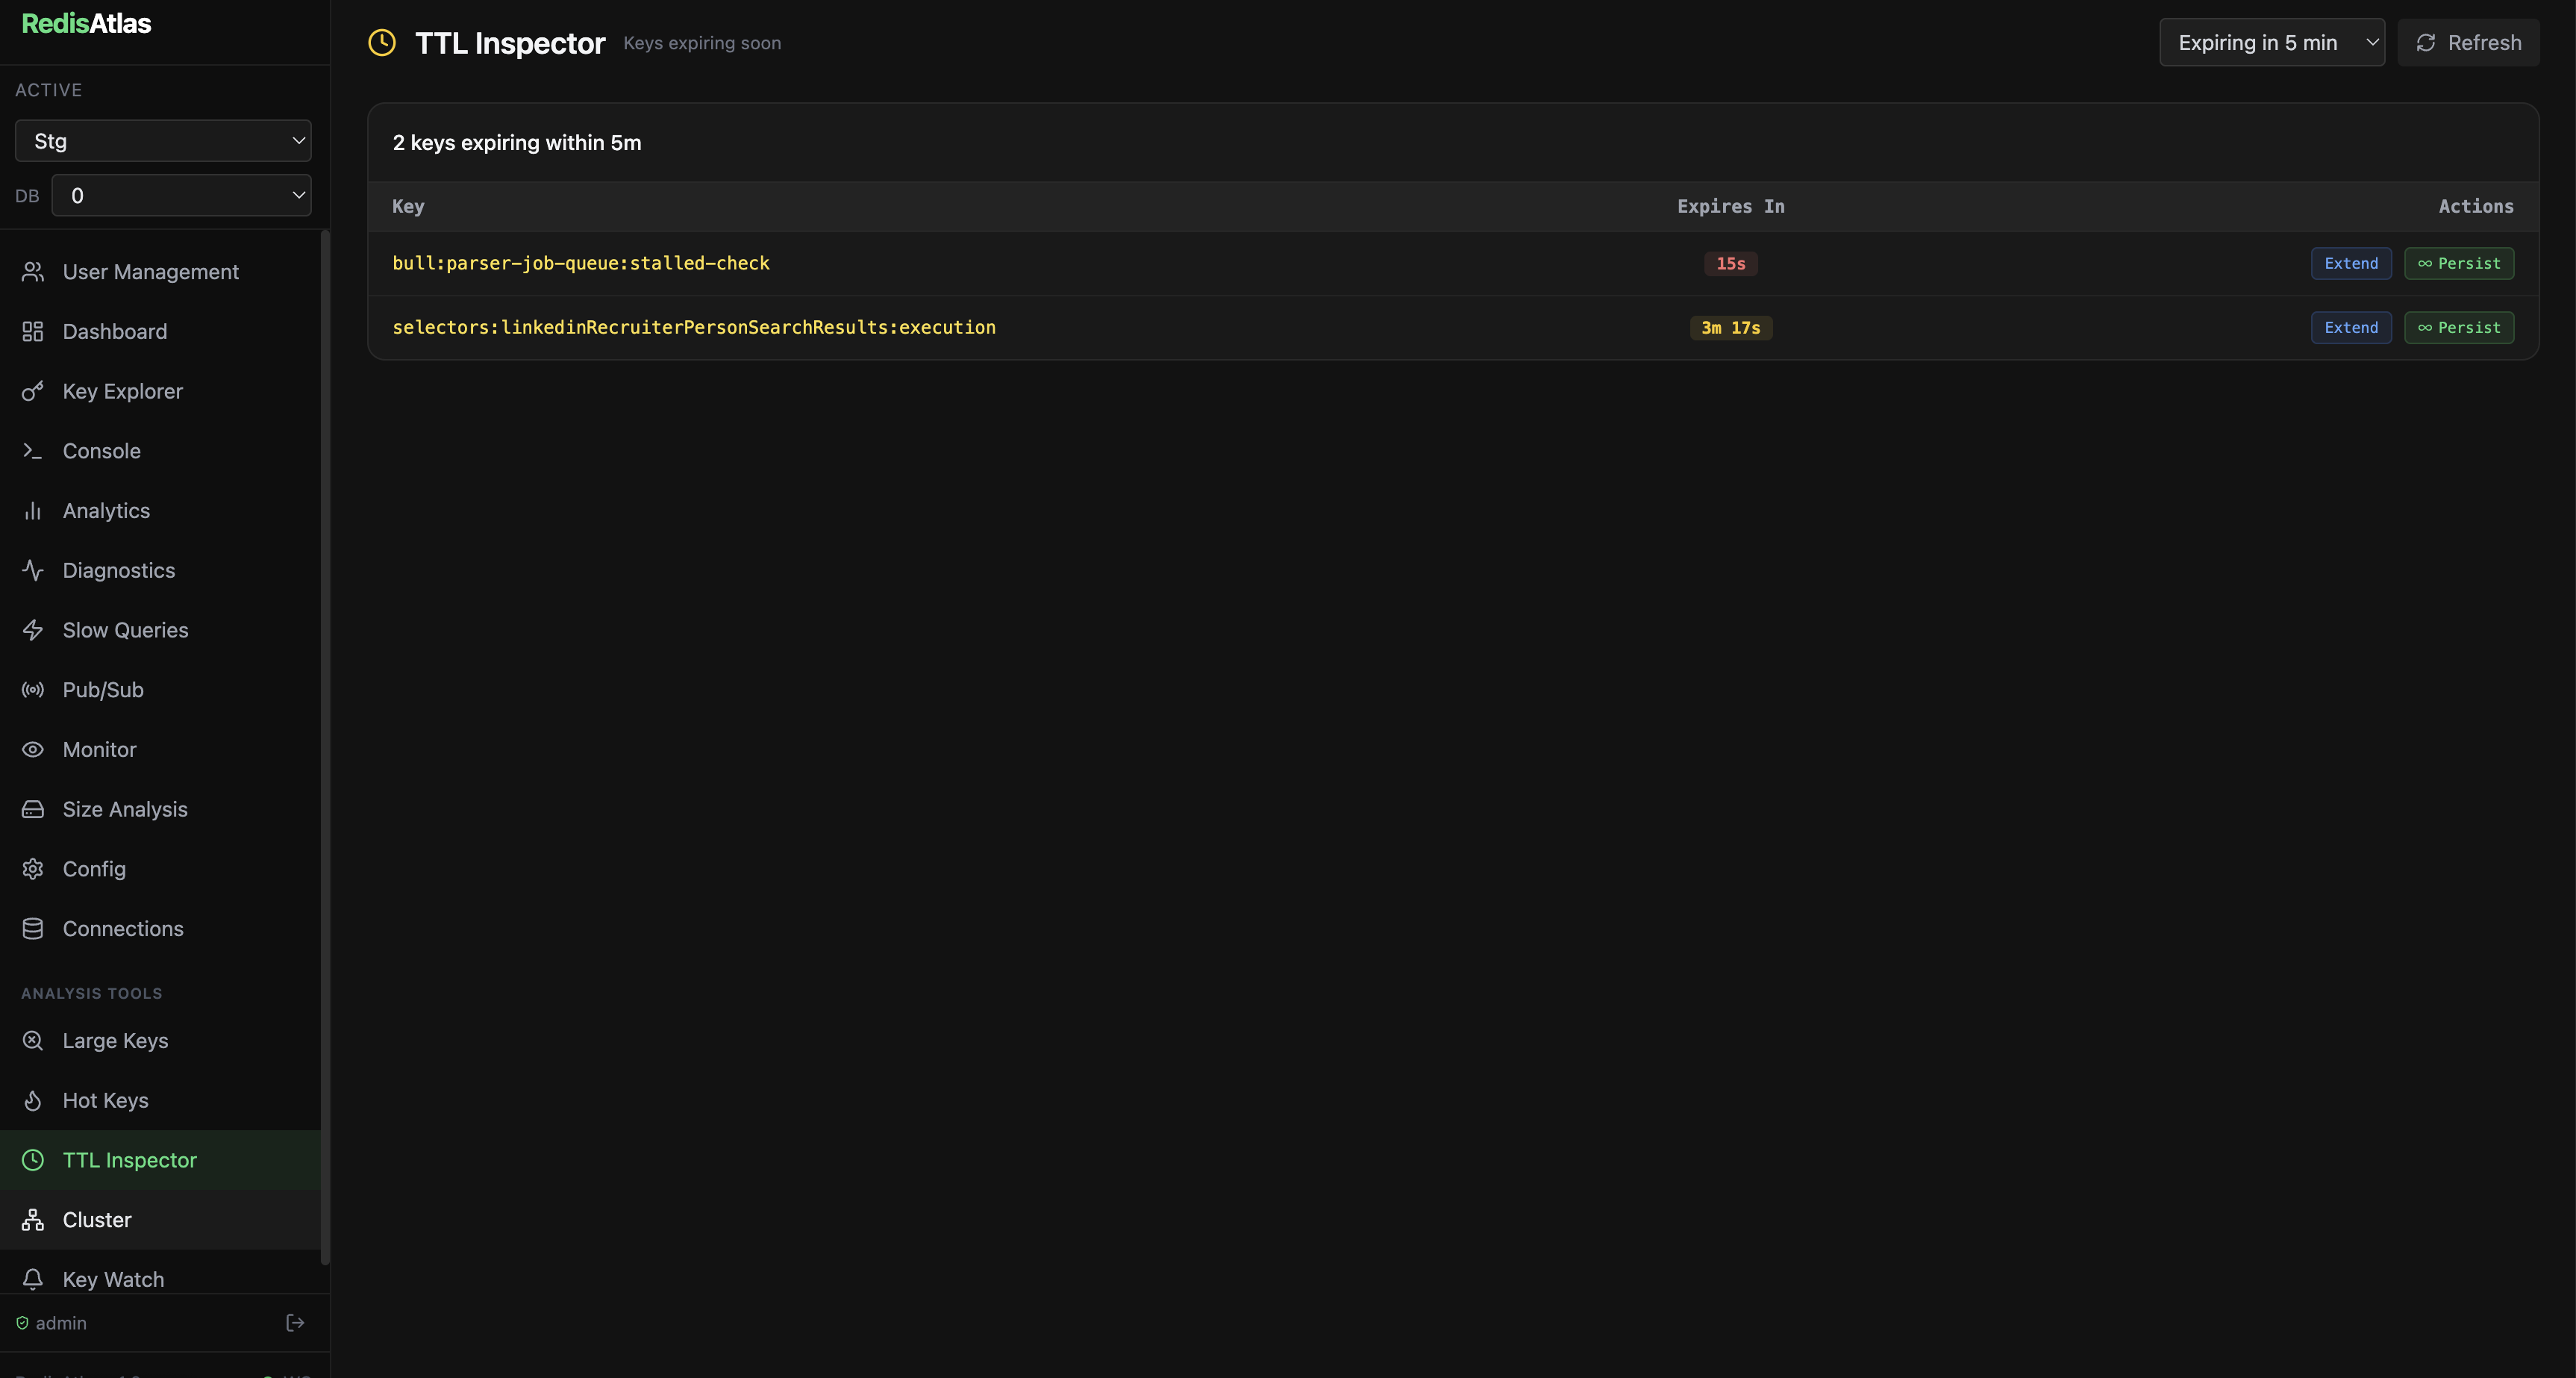
TTL Distribution
Histogram of sampled keyspace TTLs across 8 buckets — from <1 min to no-TTL — so you can spot missing or runaway expiry policies.
📈
Memory OOM Tracker
Linear-regression projection of memory growth over your history window, with a red maxmemory reference line and estimated time-to-OOM.
🛡️
ACL Rule Builder
Visual editor for Redis ACL users — command categories, key pattern restrictions, password management. No hand-editing of ACL strings required.
⚡
Redis Functions Editor
Load, browse, and test Redis 7+ Lua function libraries. Inline FCALL test runner with keys and args. Delete with confirmation.
⏱️
TTL Audit Report
Scan the keyspace for persistent keys with no TTL. Per-namespace count and estimated memory, with bulk TTL apply action.
💰
Memory Cost Breakdown
Per-namespace encoding distribution with optimization recommendations and estimated savings. CSV export for cost attribution.
🔗
Webhook Delivery Dashboard
Track every outbound alert webhook delivery. Success-rate sparkline, per-row retry, and test-fire to validate endpoints before real alerts trigger.
🔭
Prometheus Endpoint
Scrape-ready /metrics endpoint in text/plain exposition format — plug directly into Prometheus or Grafana Agent.
📉
Predictive Alerting
Linear-regression forecast on metrics history. Alert before a threshold is hit — configure a horizon (e.g. "2 hours") and let the math do the watching.
🔥
Command Profiler
Cross-join of COMMANDSTATS × LATENCY HISTORY. Tier-coloured flame chart (critical / slow / normal / fast) with actionable recommendations per command.
🚀
Data Migration Wizard
Copy keys between Redis instances with SCAN + DUMP/RESTORE. TTL-preserving, pauseable, resumable. Pre-flight validation, live keys/sec progress.
🔀
Transaction Debugger
Step through WATCH/MULTI/EXEC blocks visually. Inject competing writes mid-transaction to test abort handling — without touching production.
🔍
Vector Search Inspector
Browse HNSW/FLAT indexes when RediSearch is installed. FT.SEARCH query builder with field selectors and paginated results.
🗂️
Search Index Management
Create, drop, and query FT indexes through a schema form. RedisJSON + RediSearch module detection with graceful fallback when modules are absent.